 Guide to the Article Series
 Part 1: Production and Purification of modRNA
 Part 2: Detection Methods and Current Evidence
Following the discussion of manufacturing and purification processes in Part 1, the focus now shifts to the analytical aspects of the debate. Whether residual DNA is present in modRNA-based vaccines, and in what quantities, depends crucially on the methods used to detect and characterize it.
The detection of residual nucleic acids is methodologically challenging. Different lysis procedures, extraction methods, and analytical platforms can lead to significantly different results. This not only complicates the interpretation of individual studies, but also raises the fundamental question of what exactly a given measurement captures under specific experimental conditions.
Part 2 therefore examines the most important analytical methods for detecting DNA and RNA, their methodological limitations, and the independent studies published to date on residual DNA in modRNA-based vaccines. Particular attention is given to the interpretive value of the methods used and the comparability of the reported results.
Note on terminology
In general usage, the term „mRNA vaccine” is common. From a technical perspective, however, the approved products consist of nucleoside-modified mRNA (modRNA). For reasons of clarity and readability, this work primarily uses the established term „mRNA vaccine”.
Table of contents
2. Methods for Measuring DNA and RNA
3. Guidelines for Limiting Residual DNA in Vaccines
4. Experimental Studies on residual DNA in mRNA-based Vaccines
5. Conclusion and Outlook
2. Methods for Measuring DNA and RNA
The analytical determination of RNA concentrations and residual DNA is a key component of quality control for modRNA-based pharmaceuticals. During the manufacturing and purification processes, complex mixtures of nucleic acids are generated, whose composition must be characterized and monitored using appropriate analytical methods. The objective is to reliably assess both the integrity and quantity of the desired mRNA, as well as possible residual components such as DNA fragments.
No single method is capable of addressing all analytical questions equally well. Rather, the available techniques differ with regard to sensitivity, specificity, quantifiability, and structural resolution. Some methods allow rapid determination of total nucleic acid concentration, while others enable the selective detection of specific DNA sequences or even the direct sequence analysis of individual molecules.
Against this background, the following sections provide a systematic overview of different methodological approaches – beginning with fundamental spectrophotometric techniques, continuing through fluorescence-based quantification methods and amplification-assisted detection procedures, and extending to sequencing-based technologies. The presentation follows a progression of increasing analytical resolution: from global concentration measurements to sequence-specific identification of individual nucleic acid components.
In addition to the functional principles of each method, their detection limits and methodological constraints are also considered, as these are of critical importance for the interpretation of possible residual DNA findings.
2.1. Spectrophotometric Methods
2.2. Fluorescence-based Quantification
2.3. Amplification-based Methods
2.4. Sequencing-based Methods
2.5. Electrophoretic Fragment Analysis
2.6. Comparison of Key Detection Methods for Nucleic Acids
2.1. Spectrophotometric Methods
Spectrophotometric methods are based on the interaction of light with matter. The intensity of light is measured before and after passing through a sample as a function of wavelength. From the measured absorption, the concentration of the substances present can be inferred under defined conditions.
UV/Vis spectrophotometry is an established method for determining total nucleic acid concentration and is used at several stages of mRNA production. It is characterized by rapid execution, low sample consumption, and comparatively low cost.
When is photometry used?
In the manufacturing process, three relevant measurement time points can typically be distinguished:
After in vitro transcription: to estimate whether the transcription reaction was successful and what total nucleic acid yield was achieved.
After purification: as a rapid control step to verify whether the mRNA concentration is within the expected range.
Before formulation: prior to encapsulation in lipid nanoparticles, the mRNA concentration is measured again, since the mixing ratio between lipids and mRNA is critical for particle formation.
It should be noted that this method cannot distinguish between RNA and DNA and therefore primarily provides an indicative measurement of total nucleic acid concentration.
Typical workflow in the manufacturing process
After purification of the mRNA and before LNP formulation, the mRNA drug substance batch undergoes a concentration measurement. For this purpose, a small sample is taken from the process vessel under controlled conditions.
Two types of instruments are available for this measurement, which differ in their handling:
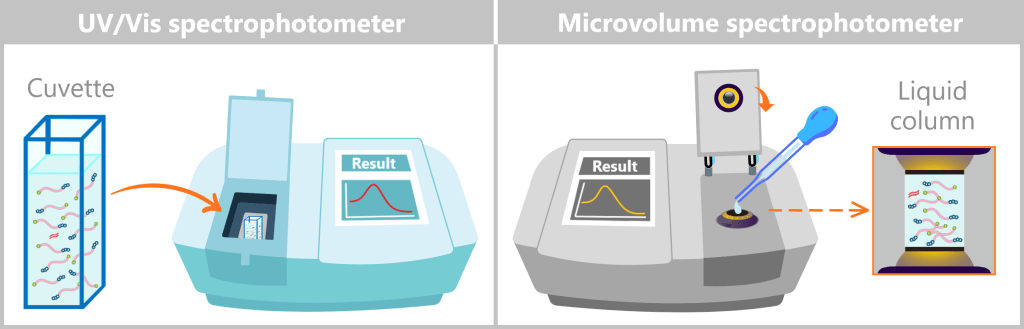
UV/Vis spectrophotometers: The sample is placed into a cuvette – a small, usually rectangular container made of UV-transparent material (e.g., quartz glass). The cuvette is inserted into the instrument, where the measurement is performed.
Microvolume spectrophotometers (e.g., NanoDrop): A tiny droplet (0,5–2,0 µl) is pipetted directly onto a measurement pedestal. A second (folded-down) pedestal forms a defined liquid column between the two optical surfaces via surface tension. The major advantage is that neither cuvettes nor significant sample volumes are required. These instruments are commonly used for DNA and RNA measurements.
Regardless of the instrument type, the actual spectrophotometric analysis takes only a few seconds. Immediately after the measurement, the result is displayed on the screen.
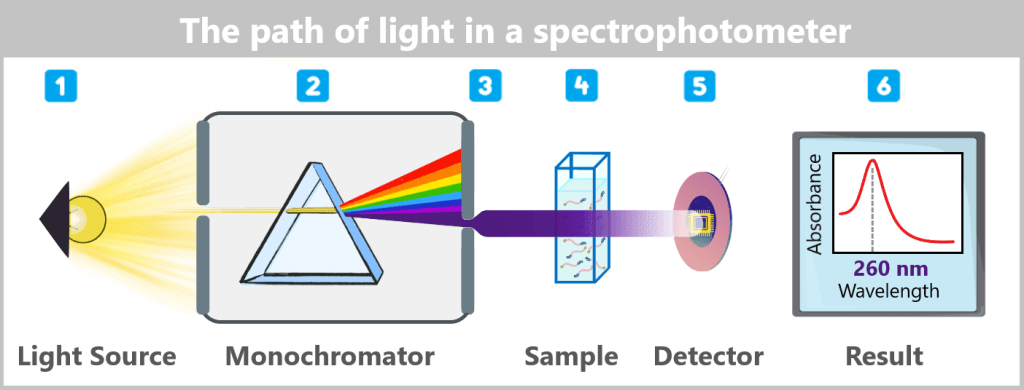
The path of light in a spectrophotometer
1️⃣ Light generation: The light source is a broadband UV/Vis lamp, for example a xenon flash lamp, which emits short, intense pulses of light covering the entire UV and visible spectrum.
2️⃣ Wavelength selection: The light passes through the entrance slit into the monochromator, where it is separated into its spectral components by a movable diffraction grating. To determine the mRNA concentration, the grating is set so that light with a wavelength of 260 nm – the absorption maximum of nucleic acids – is directed onto the sample.
3️⃣ Light guidance to the sample: A system of mirrors and lenses focuses the monochromatic light beam and precisely directs it onto the sample – either onto the cuvette or directly onto the suspended sample droplet.
4️⃣ Interaction with the sample: A portion of the light is absorbed by the nucleic acid molecules, while the remainder is transmitted through the sample.
5️⃣ Detection: The transmitted light reaches a detector (e.g., a photodiode or a CCD sensor), which measures the incoming light intensity.
6️⃣ Calculation: The instrument compares the measured intensity with the intensity of the incident light (reference measurement without a sample). Based on the ratio of incident to transmitted light intensity, the instrument calculates the absorbance in accordance with Lambert-Beer’s law; given the known layer thickness, this allows the concentration of nucleic acids in the sample to be determined.
Why do RNA and DNA absorb at 260 nm?
The absorption of UV light at 260 nm is a characteristic property of the nucleobases – the „letters” that make up the genetic code. Since these bases are nearly identical in RNA and DNA, both molecules exhibit very similar absorption behavior.
The secret lies in their chemical structure: the bases contain so-called aromatic rings. In these rings, electrons are not fixed between specific atoms but are distributed across the entire ring system. These „delocalized electrons” can be imagined as a kind of electron cloud spread over the molecule.
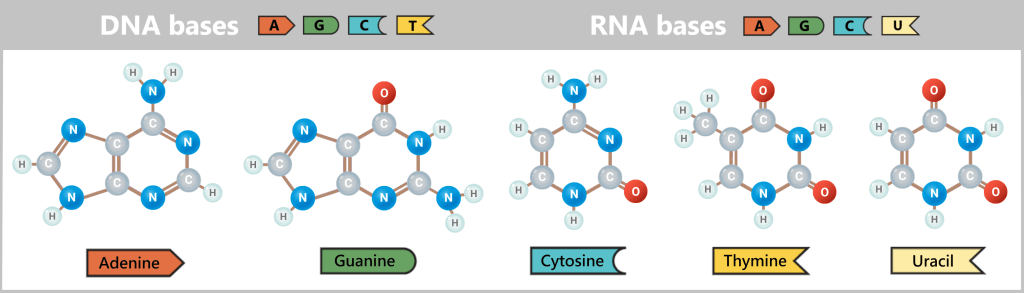
The illustration shows the two types of bases: the larger double-ring structures (purines: A and G) and the smaller single-ring structures (pyrimidines: C, T, and U). Despite their different sizes, both types contain a system of alternating double bonds. This allows the electrons to be delocalized across the entire ring system, forming a shared electron cloud.
When a photon (a particle of light) with a wavelength of around 260 nm encounters this electron cloud, its energy precisely matches the energetic properties of the electrons in these rings. An electron absorbs the photon’s energy entirely and is thereby promoted to a higher energy level – the so-called excited state. The energy of the photon is fully transferred to the electron, meaning the photon no longer exists as a light particle; this process is referred to as absorption.
Since both RNA and DNA consist of the same types of bases (with the exception of uracil replacing thymine), both types of molecules exhibit nearly identical behavior under UV light. Spectrophotometry therefore cannot directly distinguish between RNA and DNA.
Significance for the assessment of residual DNA
The physical principles described above also explain a key limitation of UV spectrophotometry: since absorption at around 260 nm is based on the shared nucleobase structures of RNA and DNA, the method only measures the total amount of nucleic acids in a sample. It is not possible to distinguish between therapeutic mRNA and any residual DNA fragments on this basis.
For the quantitative determination of specific residual DNA sequences, analytical methods are therefore required that either selectively detect double-stranded DNA or amplify defined target sequences. In practice, fluorometric DNA assays (e.g., Qubit technologies) and quantitative polymerase chain reaction (qPCR) are particularly important in this context.
The discussion of suitable methods for detecting residual DNA therefore focuses less on photometric techniques and primarily on molecular biological and fluorescence-based approaches.
2.2. Fluorescence-based Quantification
2.2.1. DNA-/RNA-Specific Dyes
    a) Mechanism of action of PicoGreen
    b) Why PicoGreen preferentially detects double-stranded DNA
    c) Limitations of the PicoGreen method
2.2.2. Qubit Systems
In contrast to UV spectrophotometry, which measures the attenuation of an incident light beam, fluorescence-based methods rely on the targeted excitation of specific molecules followed by measurement of the light they emit. (Put more simply: while UV spectrophotometry determines how much light „disappears”, fluorescence measures not the shadow, but the glow.)
In this process, a fluorescent dye is added to the sample. The dye itself exhibits little or no fluorescence. Only after binding to a target structure – such as double-stranded DNA or RNA – does its spatial arrangement change, so that, when excited by light of a specific wavelength, it emits a characteristic fluorescent signal. The intensity of this emitted light is proportional to the amount of bound nucleic acid.
The key feature of fluorescence-based methods is their selectivity: by using appropriate dyes, specific types of nucleic acids can be selectively detected, while other sample components remain largely ignored. This allows for substantially more specific quantification than the non-specific UV absorption at 260 nm.
Particularly at low concentrations, such as in the determination of residual DNA in mRNA preparations, fluorescence-based methods offer significantly higher sensitivity.
2.2.1. DNA-/RNA-Specific Dyes
The basis of fluorescence-based quantification is formed by nucleic acid-binding dyes that selectively interact with DNA or RNA.
Double-stranded DNA-specific dyes
A commonly used DNA-specific dye is PicoGreen. It preferentially binds to double-stranded DNA. In free solution, PicoGreen exhibits only very weak intrinsic fluorescence. Only after binding to DNA does its fluorescence intensity increase dramatically. This enables the quantification of even very small amounts of DNA.
RNA-specific dyes
For RNA, RiboGreen is frequently used. This dye also produces a strong fluorescent signal only after binding to RNA.
The differing binding affinities of these dyes allow for a largely selective detection of the respective type of nucleic acid.
The measurement principle always follows the same basic scheme:
- Addition of a specific dye to the sample
- Binding of the dye to the target nucleic acid
- Excitation with light of a defined wavelength (λEX – excitation)
- Measurement of the emitted fluorescence (λEM – emission)
- Comparison with a calibration series of known concentrations
Since only the bound dye produces a strong signal, background fluorescence remains low. This explains the high sensitivity of this method compared with UV spectrophotometry.
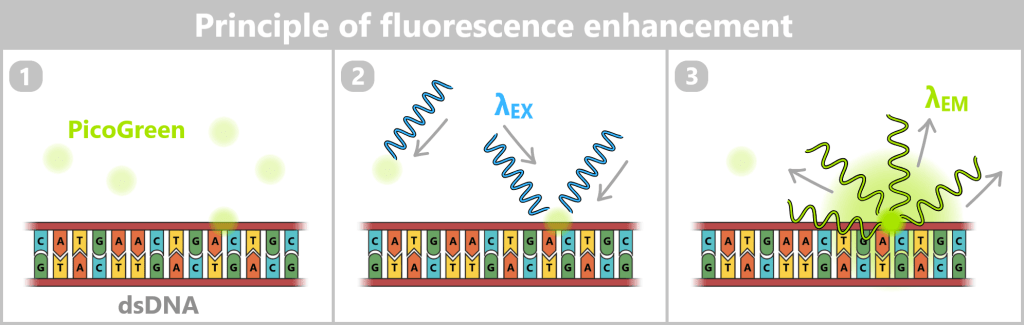
1) After addition of the fluorescent dye (e.g., PicoGreen), preferential binding to double-stranded DNA (dsDNA) occurs.
2) The sample is irradiated with short-wavelength, high-energy light of a defined wavelength (λEX ≈ 480 nm, blue), which excites the dye molecules.
3) Upon returning to the ground state, the bound dye emits light of a longer wavelength (λEM ≈ 520 nm, green). Within the linear measurement range, the measured fluorescence intensity is proportional to the DNA concentration present in the sample. Since free dye exhibits only very weak intrinsic fluorescence, a strong signal is generated primarily by DNA-bound molecules.
Quantification is performed by comparing the signal intensity with a standard curve of known DNA concentrations.
a) Mechanism of action of PicoGreen
PicoGreen is a fluorescent dye with a high affinity for double-stranded DNA (dsDNA). Its exceptional sensitivity is based on the fact that it exhibits almost no fluorescence in its free state, but fluoresces very strongly after binding to DNA.
The difference between these two states (free vs. bound) is crucial for analytical application.
Free PicoGreen in solution
In aqueous solution, the molecule is highly mobile:
- It can rotate and bend.
- Its aromatic ring systems can move relative to each other.
- It constantly collides with water molecules.
When the molecule is excited by light, it absorbs energy. In its free state, however, this energy is not primarily released as light. Instead, it is dissipated through molecular motion and interactions with water, being converted into heat. As a result, intrinsic fluorescence is very low. Free PicoGreen therefore remains almost „dark”.
Approach to double-stranded DNA
PicoGreen carries positive charges. The DNA backbone is negatively charged due to its phosphate groups. This creates an electrostatic attraction between the dye and DNA. The molecule preferentially associates with double-stranded DNA (dsDNA), particularly in regions where the two DNA strands are closely aligned. This initial approach is a prerequisite for a more stable binding interaction.
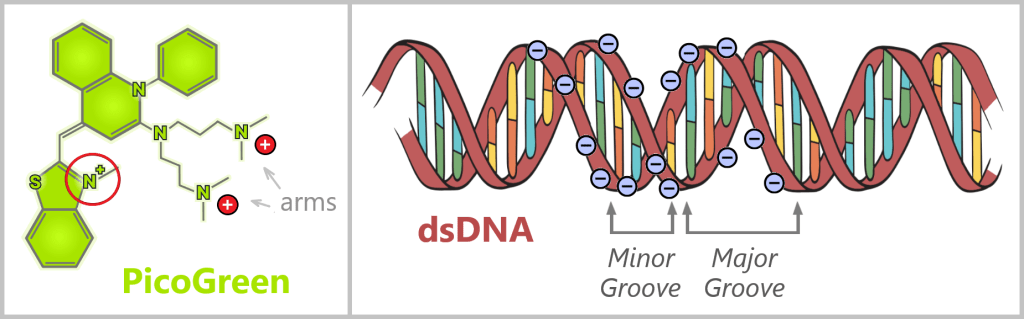
On the left, a simplified structure of the fluorescent dye PicoGreen is shown. The hexagonal and pentagonal shapes in the structure represent aromatic ring systems – particularly stable, planar molecular units capable of absorbing UV light. In addition, the dye contains positively charged side groups.
On the right, double-stranded DNA is depicted with its negatively charged sugar-phosphate backbone. The electrostatic attraction between the positively charged side groups of the dye and the negatively charged DNA backbone initially brings the dye into close proximity to the DNA.
Binding and fixation
After binding, the molecule’s mobility is strongly restricted:
- It can hardly rotate or bend anymore.
- Parts of the molecule are positioned between or close to the base pairs.
- Direct contact with water is partially reduced.
In this sense, DNA acts like a scaffold that stabilizes the molecule in a fixed position.
Why fluorescence increases strongly
This fixation changes the molecule’s energy dissipation pathways: in the free state, a large portion of the absorbed energy is lost through molecular motion. In the bound state, these motions are strongly restricted.
As a result, the probability that the absorbed energy is released as light – i.e., as fluorescence – increases significantly. The outcome is a much stronger signal.
The difference between free and DNA-bound PicoGreen is so pronounced that even very small amounts of double-stranded DNA can be reliably detected.
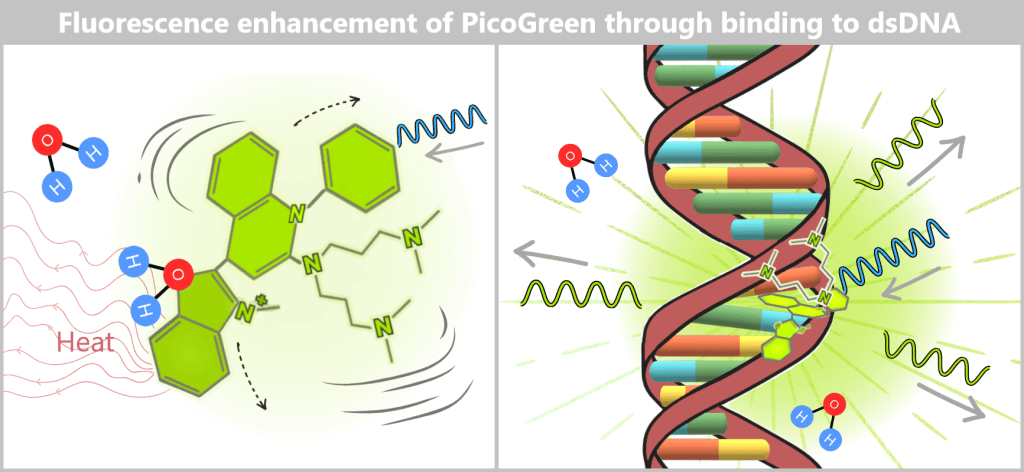
Left: PicoGreen in aqueous solution (without DNA)
In aqueous solution, the dye molecule is in constant motion: it rotates and undergoes intramolecular vibrations. When excited with blue light, it dissipates most of the absorbed energy through these motions into the surrounding water as heat. As a result, the dye exhibits only very weak intrinsic fluorescence.
Right: PicoGreen bound to dsDNA
After binding to double-stranded DNA, PicoGreen inserts into the minor groove and is further stabilized by stacking interactions with the bases. This strongly restricts its molecular mobility. As a consequence, less of the absorbed energy is lost through molecular motion, and a much larger fraction is emitted as green light. The fluorescence intensity therefore increases significantly.
Why this property is analytically so valuable
- Free dye produces almost no background signal.
- Only bound dye generates a strong fluorescent signal.
- Double-stranded DNA is preferentially detected.
In the context of measuring residual DNA in mRNA preparations – even at very low concentrations – this strong contrast between „dark” and „bright” is crucial for the sensitivity of the method.
b) Why PicoGreen preferentially detects double-stranded DNA
The selectivity of PicoGreen is not based on the dye „recognizing” DNA in a conscious sense, but rather on structural features of double-stranded DNA.
Double-stranded DNA has:
- a regularly arranged stacked base structure
- tightly packed, planar base pairs
- clearly defined major and minor grooves
- a stable, spatially ordered conformation
This ordered architecture provides suitable binding sites for the dye. It can intercalate between or bind close to the stacked bases and is thereby mechanically constrained. This restriction is exactly what drives the strong increase in fluorescence.
Single-stranded DNA or RNA have a much more flexible structure. They lack the regularly stacked base organization of the double helix. Although interactions can still occur, they are:
- weaker in binding strength
- less stable in structural fixation
- associated with a much smaller fluorescence enhancement
Therefore, PicoGreen reacts particularly sensitively to double-stranded DNA – and much more weakly to RNA or single-stranded nucleic acids.
For the analysis of residual DNA, this property is crucial: residual plasmid DNA or DNA fragments are typically double-stranded and therefore generate a strong signal.
Although DNA-specific fluorescent dyes such as PicoGreen show a strong preference for double-stranded DNA, their selectivity is not absolute. Especially in samples with very high RNA concentrations, nonspecific signal contributions may occur. These can arise from weak binding to RNA, secondary RNA structures, or simple mass effects. Without appropriate control measures – such as RNase treatment – this may lead to an overestimation of the DNA content.
c) Limitations of the PicoGreen method
Despite its high sensitivity, the method remains a quantitative bulk measurement of dsDNA. It does not provide information about:
- the sequence of the DNA
- its exact origin
- its biological functionality
- the fragment composition
Influence of fragment length
The signal intensity depends, among other factors, on how many binding sites are available. Very short DNA fragments can bind fewer dye molecules than long, intact molecules.
This means that two samples with an identical mass of DNA can produce slightly different fluorescence signals depending on the degree of fragmentation.
In practice, this effect is accounted for using calibration standards, but it cannot be completely eliminated.
Matrix effects
Components of the sample can influence the measurement result, such as:
- high salt concentrations
- residual proteins
- surfactants or lipid components
- buffer composition
Such factors can affect binding efficiency or fluorescence intensity. For this reason, measurement conditions are standardized and validated.
✧ ✧ ✧
Interim conclusion
Fluorescence-based methods such as PicoGreen enable highly sensitive quantification of double-stranded DNA and are fundamentally well suited for detecting small amounts of DNA even in complex samples.
However, the method is not based on sequence-specific recognition but on structural properties of nucleic acids. The measured signal can therefore be influenced by factors such as residual RNA, fragment length, secondary structures, or components of the sample matrix. Without appropriate control measures – in particular RNase treatment and standardized sample preparation – there is a risk of over- or underestimating the actual DNA content.
PicoGreen therefore primarily answers the question of how much fluorescence-active double-stranded DNA is present in a sample. It does not provide information about the sequence, origin, integrity, or biological functionality of the DNA.
For such questions, complementary sequence- or amplification-based methods are required, which are discussed in the following chapter.
2.2.2. Qubit systems
While DNA- and RNA-specific dyes such as PicoGreen or RiboGreen represent the actual fluorescent tools used for nucleic acid quantification, the Qubit system refers to the integrated analytical platform designed for precise concentration measurement based on these dyes.
The Qubit system is a compact fluorometer developed by Thermo Fisher Scientific for the highly sensitive and specific quantification of DNA, RNA, and proteins. It combines:
- specific fluorescent dyes = molecular sensors
- optimized reagent solutions = defined environment (buffer system)
- standardized assay protocols = standardized operating procedures
The aim of this system is the selective and sensitive quantification of DNA or RNA in biological samples.
Principle of the Qubit system
The underlying measurement principle corresponds to the method described previously (Chapter 2.2.1): a selective fluorescent dye binds to the target nucleic acid, is excited with light of a defined wavelength, and emits a measurable fluorescence signal. The intensity of this signal is proportional to the amount of bound DNA or RNA. By comparison with standard solutions of known concentration, the concentration of the sample can then be determined.
The Measurement Procedure
The procedure is intentionally simple and follows a standardized protocol:
1️⃣ Preparation of the working solution: The fluorescent dye (from the assay kit) is mixed with the supplied buffer in the recommended ratio.
Examples of available assay kits:
| Assay kit | Intended application |
| dsDNA BR (Broad Range) | Higher DNA concentrations |
| dsDNA HS (High Sensitivity) | Low DNA concentrations |
| RNA BR (Broad Range) | Higher RNA concentrations |
| RNA HS (High Sensitivity) | Lower RNA concentrations |
| microRNA Assay | Small RNA molecules such as miRNA and siRNA |
| Protein Assay | Quantification of proteins |
2️⃣ Addition of the sample: A small volume of the sample (typically 1–20 µl) is added to the working solution.
3️⃣ Allow binding to occur: After a short incubation period of only about 2 minutes (for DNA/RNA assays), the dye binds specifically to its target molecule.
4️⃣ Calibration using standards: One or two supplied standards with known concentrations are measured. The instrument automatically generates a standard curve from these measurements.
5️⃣ Insert the sample into the instrument:
Excitation: The instrument irradiates the sample with the appropriate excitation wavelength, e.g., blue light at approximately 470 nm for DNA quantification.
Emission: The bound dye molecules absorb this light and re-emit it at a longer wavelength (lower energy), for example green light at approximately 520 nm.
Filtering: An optical filter inside the instrument blocks the blue excitation light so that the detector registers only the green fluorescence emitted by the sample. This explains the high accuracy of the system: the instrument „sees” only the target signal, while interfering excitation light is excluded.
6️⃣ Measurement and result: The instrument measures the emitted longer-wavelength light (e.g., green fluorescence). Within seconds, an algorithm calculates the exact concentration based on the standard curve. The result is displayed on the screen.
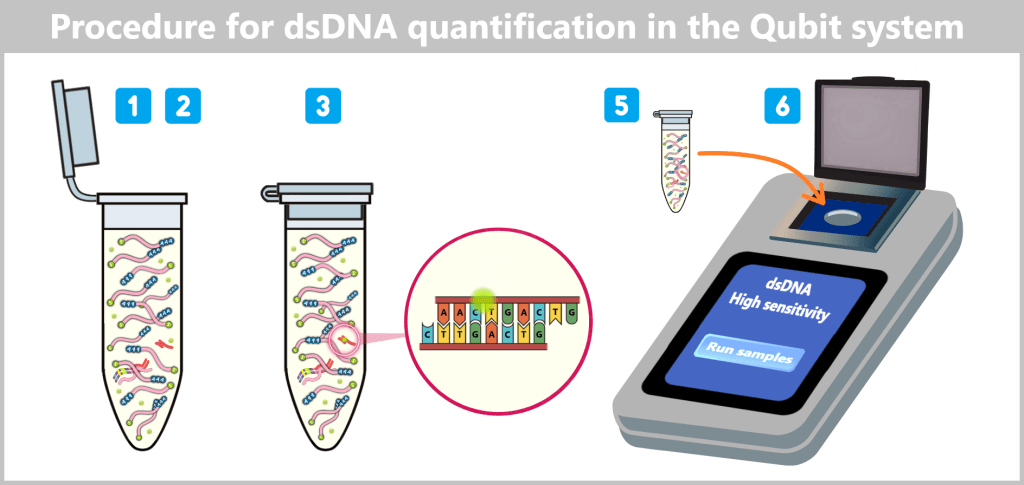
The illustration shows the workflow of dsDNA quantification with the Qubit system. After addition of the specific fluorescent dye to the sample (1–2), the dye selectively binds to double-stranded DNA (3). The sample is then inserted into the Qubit fluorometer (5), which measures the fluorescence intensity and calculates the DNA concentration (6).
Advantages of the Qubit system
- High specificity and selectivity: The fluorescent dyes used exhibit a strong preference for their respective target molecules. This allows, for example, relatively selective quantification of double-stranded DNA (dsDNA) even in the presence of larger amounts of RNA. However, nonspecific signal contributions cannot be completely excluded, particularly at very high RNA concentrations or in complex sample matrices.
- High sensitivity: Compared with UV photometry, the method is significantly more sensitive and allows the quantification of very low nucleic acid concentrations.
- Low sample consumption: Only small sample volumes are required for measurement (typically 1–20 µl), which is especially advantageous when sample material is limited or valuable.
- Relative robustness against contaminants: Many substances that can interfere with UV spectroscopic methods – such as free nucleotides, salts, or proteins – have a much smaller effect on fluorometric measurements. Nevertheless, certain matrix components may still influence fluorescence.
- Simple handling and rapid results: The system is based on standardized procedures and enables reproducible measurements with comparatively low effort.
Limitations of the Qubit system
- No information on DNA integrity: The method does not distinguish between intact and fragmented DNA.
- No sequence information: The measurement provides no information about the sequence, origin, or biological function of the nucleic acids.
- Influence of fragment length: Different fragment lengths can affect signal intensity. Very short or highly degraded fragments may produce a reduced fluorescence signal.
- Residual nonspecificity at high RNA concentrations: Very high RNA concentrations can lead to nonspecific signal contributions despite the high specificity of the dyes.
- Limited linear measurement range: Quantification is restricted to the linear range of the respective assay. Highly concentrated samples therefore need to be diluted accordingly.
- Limited information on sample purity: Only limited conclusions can be drawn regarding sample purity, composition, or possible contamination.
✧ ✧ ✧
Summary
Qubit fluorometry is considered a sensitive and comparatively selective method for the quantification of DNA and RNA. In contrast to UV spectroscopy, it is not based on nonspecific light absorption but on fluorescent dyes with a strong preference for specific nucleic acid structures. This enables the measurement of low concentrations even in complex samples.
However, the method remains a structure-dependent bulk measurement: it provides information about the amount of specific nucleic acid types, but not about their sequence, origin, or biological properties. For such questions, sequence- or amplification-based methods are required, which are discussed in the following chapters.
2.3. Amplification-based Methods
The previously described methods (UV spectroscopy and fluorometry) allow the determination of the total amount of nucleic acids – i.e. RNA and/or DNA. However, for the targeted detection of specific DNA or RNA sequences, methods based on amplification of the target sequence are required. This principle is referred to as amplification.
In the manufacturing process, amplification-based methods are used in particular to detect residual DNA impurities.
The basis of these methods is the polymerase chain reaction (PCR). In this process, a predefined DNA segment is exponentially amplified through repeated cycles of enzymatic synthesis, meaning that the amount of the target sequence ideally doubles in each cycle. Even a few initial copies can thus be converted into a measurable quantity. Both quantitative PCR (qPCR) and digital PCR (ddPCR) are based on this principle.
2.3.1. quantitative PCR (qPCR)
2.3.2. digital PCR (ddPCR)
2.3.3. Comparison of PCR-based quantification methods
⚬ ⚬ ⚬
2.3.1. Quantitative Polymerase Chain Reaction (qPCR)
Quantitative PCR, also known as real-time PCR, is an advanced version of conventional PCR. It enables the simultaneous amplification and quantification of a specific DNA segment in real time.
The basic reaction steps correspond to those of conventional PCR, as described in the first part (amplification of spike DNA by PCR). The key difference is that during each amplification cycle, the amount of newly formed DNA is measured via a fluorescent signal.
In qPCR, a fluorophore is used as a „light signal”. In principle, two strategies can be distinguished:
a) Dye-based qPCR
b) Probe-based qPCR
◦ ◦ ◦
a) Dye-based qPCR (e.g., SYBR® Green)
For the analysis, a reaction mixture is added to the sample consisting of:
- free nucleotides
- a specific primer pair
- a thermostable DNA polymerase
- a buffer containing Mg²⁺ ions (for polymerase activity)
- a fluorescent dye (e.g., SYBR® Green)
SYBR® Green is a fluorophore that selectively binds to double-stranded DNA. Only after binding to dsDNA does the dye exhibit strong fluorescence.
This mixture is placed into a qPCR instrument – a so-called real-time PCR thermocycler.
Principle of the method
1️⃣ Denaturation: The reaction mixture is heated to approximately 94–98 °C. At this temperature, hydrogen bonds between base pairs are broken, and the double-stranded DNA is separated into two single strands.
2️⃣ Primer annealing: The temperature is lowered to approximately 50–65 °C. Specific primers bind to their complementary target sequences on the single strands. They define the starting point of DNA synthesis.
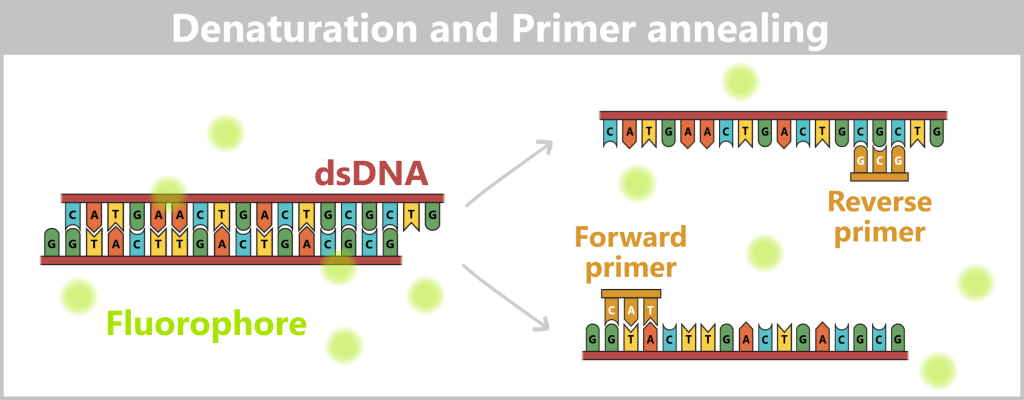
Left: The dye SYBR® Green is added to the reaction mixture before the start of PCR. It binds selectively to double-stranded DNA and exhibits strong fluorescence in its bound state.
Right: During denaturation, double-stranded DNA is separated into single strands. The bound dye is released in the process and largely loses its fluorescence. Subsequently, specific primers bind to their complementary target sequences. (Note: For clarity, the primers are shown shortened with only three nucleotides; in practice, they are significantly longer.)
3️⃣ DNA synthesis (amplification): At approximately 72 °C, the DNA polymerase synthesizes the complementary strand. This results in the formation of new double-stranded DNA. SYBR® Green binds to this newly formed dsDNA.
4️⃣ Excitation and emission: The reaction mixture is irradiated with blue light (approx. 490 nm). The bound dye molecules absorb this energy and emit green light (approx. 520 nm). The DNA-bound dye generates a measurable fluorescence signal.
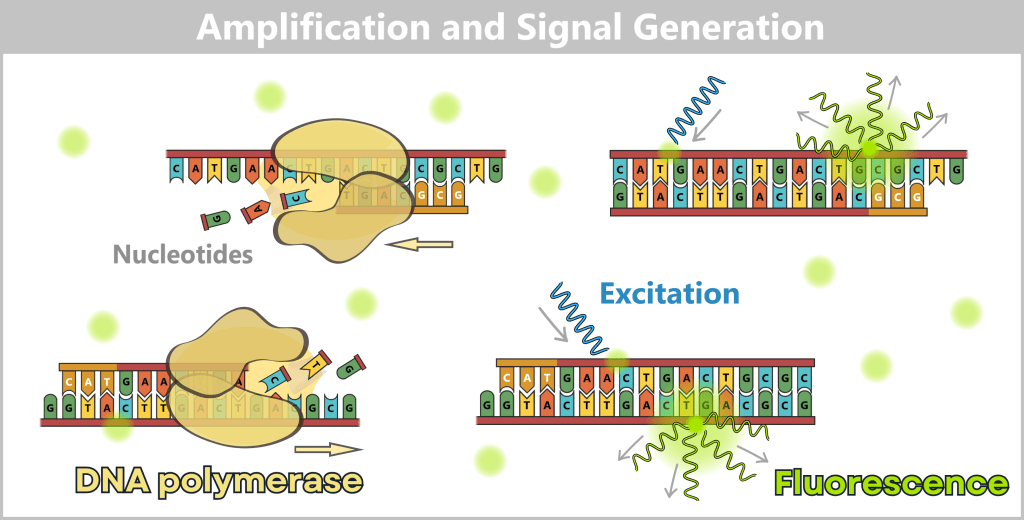
Left: DNA polymerase synthesizes new complementary strands. This results in the formation of new double-stranded DNA, to which SYBR® Green immediately binds.
Right: At the end of the cycle, the reaction mixture is excited with light of an appropriate wavelength. The dye molecules bound to double-stranded DNA emit green fluorescence light, the intensity of which is proportional to the amount of DNA formed.
5️⃣ Quantification: Fluorescence is measured at the end of each cycle. As the amount of DNA increases, the signal rises accordingly, producing a characteristic amplification curve.
The key measurement parameter is the so-called Ct value (cycle threshold). It refers to the cycle at which the fluorescence signal first exceeds a defined threshold.
- Low Ct value → high initial amount of target DNA
- High Ct value → low initial amount of target DNA
For absolute quantification, a standard curve based on known reference concentrations is typically generated.
Significance of amplicon length for detection
An amplicon refers to the DNA fragment that is amplified during PCR between the two primer binding sites – including the primers themselves.
Specific detection of the target sequence requires that a complete amplicon can be formed. This is only possible if both primers – forward and reverse – can bind to the same DNA fragment. If the fragment is shorter than the distance between the two primer binding sites, one of the primers cannot bind. Efficient exponential amplification does not occur, and no meaningful fluorescence signal is generated.
This leads to an important methodological consequence: the longer the chosen amplicon – i.e., the greater the distance between the two primer binding sites – the more short fragments remain undetected. This is not because they are absent, but because they are too short for the assay. Thus, the choice of amplicon length directly influences which fraction of the actual DNA present is detected.
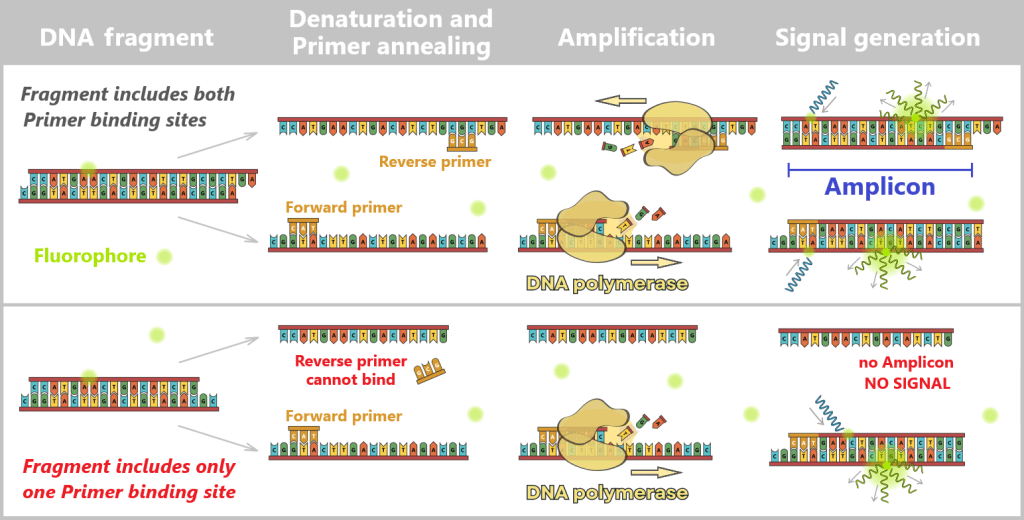
Top: Fragment contains both primer binding sites
The DNA fragment is long enough for both primers (forward and reverse primer) to bind to their respective binding sites. DNA polymerase can fully copy the region between the primers. A specific amplicon of defined length is generated. In the next cycle, this product can again be efficiently amplified. As a result, a strong fluorescence signal is produced with SYBR Green (proportional to the amount of specific dsDNA).
Bottom: Fragment contains only one primer binding site
The DNA fragment is shorter than the distance between the two primer binding sites. Only one primer can bind (the other has no complementary sequence). No complete amplicon is formed, and therefore no exponential amplification occurs. As a result, no or only a very weak SYBR Green fluorescence signal is generated.
Note: For clarity, the primers are shown shortened with only three nucleotides; in practice, they are significantly longer. The schematic representation of DNA fragments is also simplified.
Advantages of dye-based qPCR
- Low cost and effort: The method is comparatively inexpensive and technically straightforward.
- Simple primer design: Only sequence-specific primers are required.
- High sensitivity: Even very small amounts of target DNA can be reliably detected.
- Fast execution: The method is widely established and enables rapid analysis of large numbers of samples. Quantification is performed directly via fluorescence detection during amplification.
- High flexibility: New target sequences can be analyzed relatively quickly by adjusting the primers.
- Melting curve analysis as quality control: After amplification, the specificity of PCR products can be assessed based on their characteristic melting temperature. This often allows the detection of nonspecific products or primer dimers.
Disadvantages of dye-based qPCR
- Nonspecific dye binding: The fluorescent dye binds to any double-stranded DNA – including nonspecific amplification products such as primer dimers.
- Dependence on primer design: The specificity of the analysis strongly depends on the quality and selectivity of the primers used.
- Influence of the target region: The choice of the target sequence and, in particular, the length of the amplified region (amplicon) significantly affects the result.
- Influence of fragment length: Highly fragmented DNA may be incompletely detected when longer amplicons are used, as both primer binding sites are often no longer present on the same fragment.
- Influence of amplicon length: Shorter amplicons generally detect fragmented DNA more efficiently, but may increase the likelihood of nonspecific signals.
- Dependence on efficiency and calibration: The accuracy of quantification is strongly influenced by PCR efficiency and the quality of the standard curve used.
b) Probe-based qPCR (e.g., TaqMan®)
For the analysis, a reaction mixture is added to the sample consisting of:
- free nucleotides
- a specific primer pair
- a thermostable DNA polymerase with 5’→3′ exonuclease activity (this polymerase can degrade obstacles in its path)
- a buffer containing Mg²⁺ ions (required for polymerase activity)
- a sequence-specific probe (e.g., a TaqMan® probe)
Structure and function of the TaqMan® probe
A TaqMan® probe is a short, synthetically produced DNA sequence that is complementary to a segment of the target sequence. The probe binds to one of the two DNA strands, specifically between the two primer binding sites.
The probe carries:
• a fluorescent dye (reporter) at the 5′ end
• a quencher molecule at the 3′ end
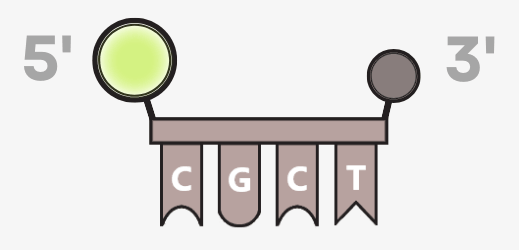
The reporter can carry different fluorophores, which also enables multiplex analyses – the simultaneous detection of multiple target sequences.
As long as reporter and quencher are in close proximity, the fluorescence signal is suppressed. Quenching only works while the probe is intact: due to the spatial proximity of reporter and quencher, fluorescence resonance energy transfer (FRET) occurs. In this process, the energy absorbed by the reporter is transferred to the quencher and dissipated as heat instead of being emitted as light.
The reaction is carried out in a real-time PCR thermocycler, which not only performs the temperature cycles but also measures fluorescence during amplification.
Principle of the method
1️⃣ Denaturation: The reaction mixture is heated to approximately 94–98 °C. Hydrogen bonds break, causing the double-stranded DNA to separate into two single strands.
2️⃣ Hybridization (primer and probe binding): The temperature is lowered to approximately 55–60 °C. In addition to the specific primers, the TaqMan probe binds to its target sequence between the primers. In this state, the fluorescence of the reporter remains suppressed due to the nearby quencher.
As soon as the temperature decreases from 95 °C to 60 °C, the probe binds to its target sequence first. The probe has a higher melting temperature (Tm), typically 8–10 °C above that of the primers, so that it is already stably bound at the chosen working temperature while the primers are just beginning to anneal.
The probe is a single-stranded DNA molecule of approximately 20–30 nucleotides in length. It is designed to bind specifically to a defined target sequence – a segment that is characteristic of the DNA of interest.
3️⃣ DNA synthesis & hydrolysis (amplification): At approximately 60 °C, DNA polymerase begins synthesizing the new strand. In many modern qPCR protocols, annealing (primer and probe binding) and elongation (DNA synthesis) occur at the same temperature.
When the polymerase encounters the bound probe during strand synthesis, it uses its 5’→3′ exonuclease activity to hydrolyze the probe (breaking it down into individual nucleotides). Even the first cleavage separates the reporter dye from the quencher.
This permanently releases the reporter from the quenched state.
4️⃣ Excitation and emission: During the measurement phase, the reaction mixture is excited with light of a specific wavelength. The released reporter molecules absorb this energy and emit light at a longer wavelength (e.g., green for FAM or yellow for VIC).
In this case, the fluorescence signal is not generated by dye binding to double-stranded DNA (as in SYBR Green), but by enzymatic cleavage of the probe during amplification.
The probe does not participate in DNA amplification. Amplification is driven exclusively by the forward and reverse primers, while the probe serves only as a sequence-specific fluorescent reporter.
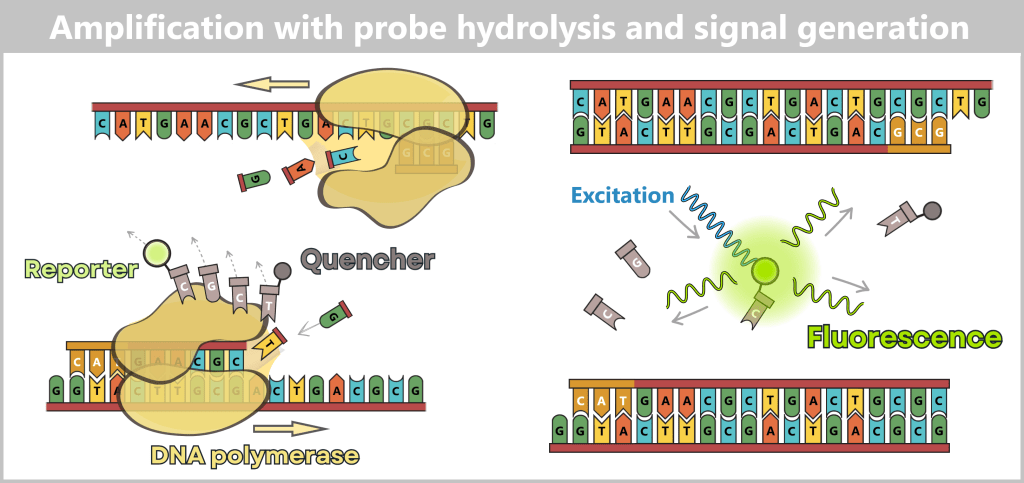
The polymerase extends from the primer and reaches the probe. While synthesizing the new DNA strand, it removes the probe that lies in its path. This separates the reporter from the quencher, thereby generating the measurable fluorescence signal.
5️⃣ Quantification: Fluorescence is measured after each cycle. For every newly synthesized DNA strand that contains an intact probe-binding site, one probe is hydrolyzed. The signal intensity therefore increases in proportion to the number of correctly amplified target molecules.
The key measurement parameter is the Ct value (cycle threshold):
- Low Ct value → high initial amount of target DNA
- High Ct value → low initial amount of target DNA
Advantages of probe-based qPCR
- High specificity: In addition to the two primers, a sequence-specific fluorescent probe also binds. A signal is only generated when the correct target sequence is actually amplified. Nonspecific amplification products such as primer dimers therefore generally do not produce a meaningful signal.
- Suitable for multiplex analyses: Different reporter dyes allow the simultaneous detection of multiple target sequences in a single reaction.
- Improved analytical robustness: The additional probe layer increases specificity and enhances the reliability of quantification, especially in complex samples with high background signals.
- Lower susceptibility to nonspecific amplification: Compared with dye-based methods, false-positive signals from nonspecific PCR products are significantly reduced.
Disadvantages of probe-based qPCR
- Higher costs: In addition to primers, a specific fluorescently labeled probe must be synthesized for each target sequence.
- More complex assay design: In addition to the primers, the probe must also be optimized in terms of sequence, melting temperature, position, and potential secondary structures.
- Dependence on the target region: Fragmentation, mutations, or damage within the primer or probe binding sites can impair or prevent amplification and signal generation.
- Influence of fragment length: As with other PCR-based methods, detectability depends on whether a DNA fragment contains all required binding sites for primers and probe. Highly fragmented DNA may therefore be incompletely detected, especially when longer target regions are used.
- Indirect quantification: Absolute quantification is usually performed using standard curves and remains dependent on amplification efficiency, assay design, and sample preparation.
✧ ✧ ✧
Detailed information on the principles of both qPCR methods can be found here.
Both dye-based and probe-based qPCR enable sensitive and specific detection of defined DNA sequences. However, quantification is indirect via the Ct value and typically requires a standard curve with known reference concentrations. The accuracy therefore depends on amplification efficiency and the quality of the reference standards.
To reduce this dependence and enable absolute quantification without a standard curve, digital PCR (ddPCR) was developed.
2.3.2. Digital PCR (ddPCR)
ddPCR stands for droplet digital PCR.
Digital PCR is an advancement of PCR technology that enables absolute quantification of DNA or RNA molecules – without the need for a standard curve and with very high precision.
In contrast to qPCR, it does not measure a continuously increasing fluorescence signal but instead counts individual positive reaction units. The result is binary – „positive” or „negative” – which is why it is referred to as digital.
Basic principle of ddPCR
While in qPCR the entire reaction takes place in a single reaction volume, in ddPCR the sample is partitioned into thousands of microscopic, separated reaction compartments – so-called droplets. Each droplet represents an independent PCR reaction.
Method Procedure (using DNA as an example):
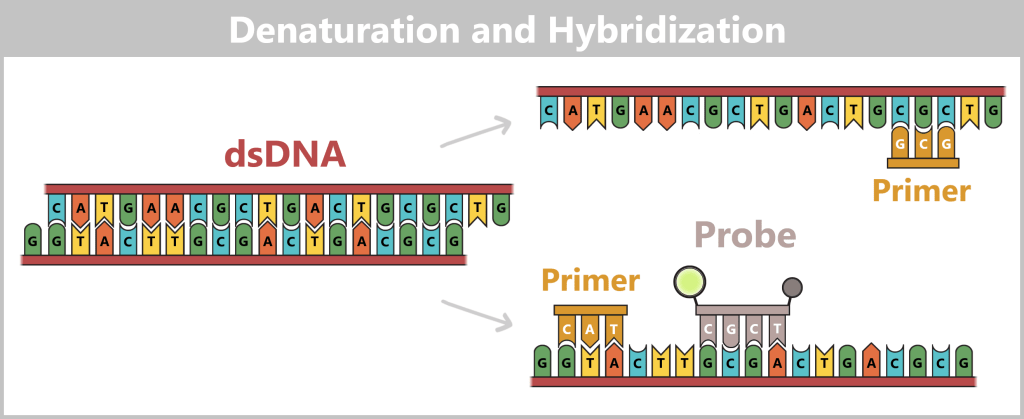
1️⃣ Sample preparation: The DNA sample is mixed with primers, a sequence-specific probe (usually TaqMan®-like), nucleotides, DNA polymerase, and buffer – analogous to probe-based qPCR.
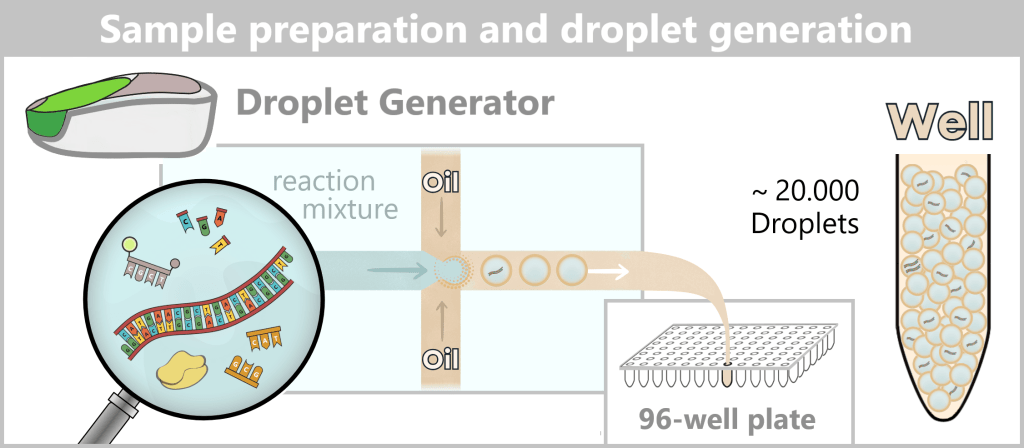
2️⃣ Partitioning (droplet generation): The reaction mixture is transferred into a droplet generator. There, it is passed through microfluidic channels together with a special oil..
Due to fluid dynamics, this process generates up to 20,000 nanoliter-sized droplets. The oil stabilizes the droplets and forms a stable emulsion, ensuring that each droplet acts as an isolated reaction compartment. The resulting droplets are collected in a well of a 96-well plate.
The distribution of DNA molecules across the droplets is random, resulting in:
- many empty droplets
- some droplets containing one target molecule
- some droplets containing multiple molecules
This distribution follows Poisson statistics.
3️⃣ Amplification (PCR): The sealed 96-well plate is transferred into a thermocycler.
The droplets undergo the standard PCR cycles (denaturation, annealing, elongation), typically 40–45 cycles.
During amplification, no fluorescence is measured.
If a droplet contains at least one target DNA molecule, it is amplified. The probe is hydrolyzed, and the droplet develops a strong fluorescent signal.
Droplets without target DNA remain dark.
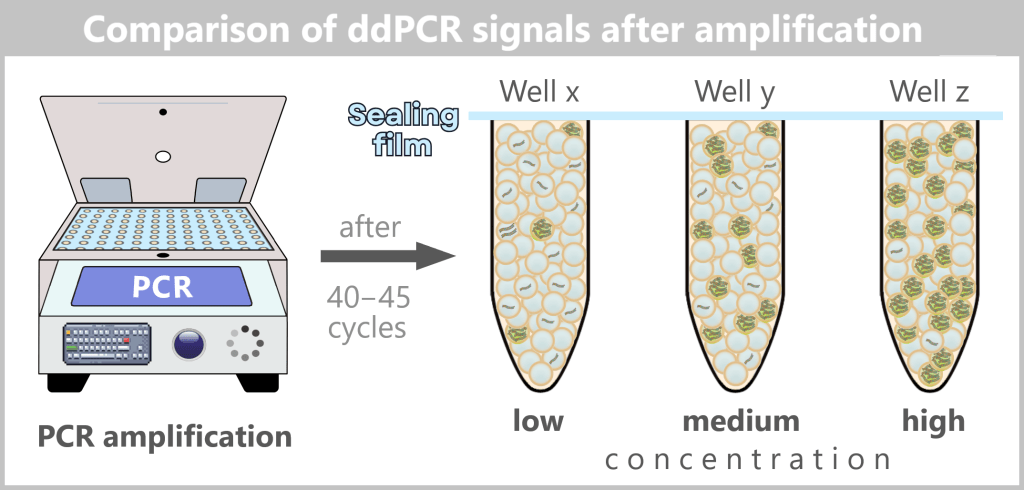
The figure schematically shows the result of droplet digital PCR (ddPCR) after completion of amplification.
The previously generated and sealed droplets undergo 40–45 PCR cycles in a thermocycler. During amplification, no continuous fluorescence measurement is performed.
If a droplet contains at least one target DNA molecule, the target sequence is amplified. During this process, the sequence-specific probe is hydrolyzed by the 5′→3′ exonuclease activity of the DNA polymerase, separating the reporter from the quencher and generating a strong fluorescence signal. Droplets without target DNA remain signal-free („negative”).
As the initial concentration of target DNA increases, the number of fluorescent (positive) droplets increases, while the intensity of individual positive droplets remains comparable.
4️⃣ Readout (droplet reader): After completion of PCR, the 96-well plate is inserted into a droplet reader.
The instrument:
- aspirates the emulsion from a well
- passes the droplets individually through a narrow capillary
- irradiates each droplet with a laser
- measures the fluorescence intensity
Each droplet is individually classified as:
• positive (fluorescence signal present)
• negative (no signal)
The result is binary – 0 or 1.
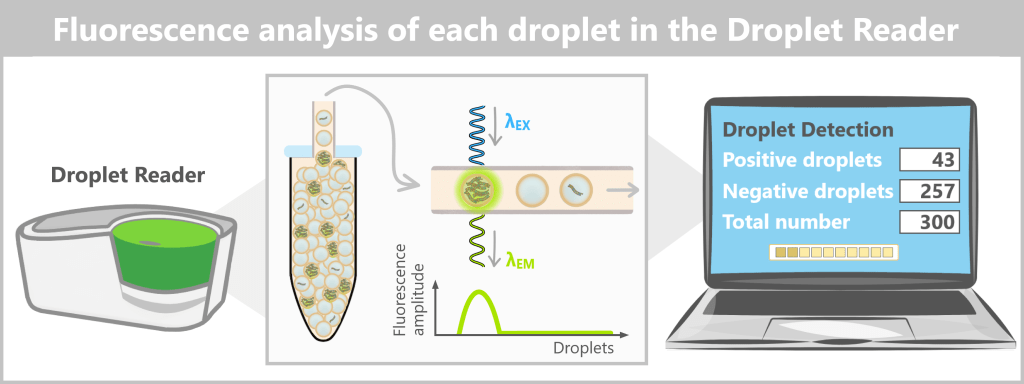
After completion of PCR, the 96-well plate containing the droplet emulsion is inserted into the droplet reader. The instrument aspirates the emulsion from a well and passes the droplets individually through a narrow capillary. Each droplet is irradiated with a laser, and the measured fluorescence intensity is recorded as an amplitude value. In the analysis software, these values are displayed in a 1D amplitude plot: the X-axis sequentially numbers the droplets, while the Y-axis shows the fluorescence amplitude. Using a software-defined threshold, negative droplets (no signal) are separated from positive droplets (fluorescence signal). The number of positive droplets is then converted into the absolute target DNA concentration of the original sample using Poisson statistics.
5️⃣ Quantification: Since it is known:
- how many droplets were analyzed in total
- how many of them are positive
the absolute number of original DNA molecules can be calculated using the Poisson distribution.
📍 No standard curve is required.
📍 Quantification is independent of amplification efficiency within individual cycles.
🎥 Tip: What this looks like in practice is demonstrated in the video „Digital PCR Using the Bio-Rad QX100™ ddPCR™ System“.
Advantages of ddPCR
- Absolute quantification without a standard curve: The number of target molecules is calculated directly from the ratio of positive to negative droplets using Poisson statistics. An external standard curve is generally not required.
- High precision and reproducibility: By partitioning the sample into thousands of independent reaction compartments, quantification becomes less susceptible to fluctuations in amplification efficiency than in conventional qPCR methods.
- High sensitivity at low concentrations: Even very small amounts of target DNA can be reliably detected because individual molecules are amplified in separate droplets.
- Relative robustness against PCR inhibitors: Inhibitors are likewise distributed among the individual droplets. As a result, their inhibitory effect is often reduced compared with a single bulk reaction.
- Endpoint measurement instead of Ct interpretation: The analysis is based on the presence or absence of a signal at the end of PCR and is therefore less dependent on the interpretation of amplification curves.
- Particularly suitable for rare target sequences: The method is frequently used for the detection of rare mutations, low viral loads, or very small amounts of residual DNA.
Disadvantages of ddPCR
- More complex technology and higher costs: In addition to a thermocycler, specialized instruments for droplet generation and droplet readout are required.
- More complex workflow: Partitioning of the sample and the subsequent droplet analysis require additional processing steps and increase technical complexity.
- Limited dynamic range per run: At very high target concentrations, too many droplets may become positive. This reduces the accuracy of the statistical analysis (saturation effect), making dilution series necessary.
- Lower sample throughput: Compared with qPCR, the analysis is generally more time-consuming and less suitable for very high sample throughput.
- Still sequence- and assay-dependent: As with qPCR, only DNA fragments containing all required primer and, where applicable, probe binding sites are detected.
- Influence of fragmentation: Highly fragmented DNA may also be incompletely detected by ddPCR, particularly when the target region is relatively long or primer binding sites are missing.
- Dependence on sample preparation: Extraction losses, incomplete LNP disruption, or selective fragment losses can still influence the result.
2.3.3. Comparison of PCR-based quantification methods
| Feature | Dye-based qPCR | Probe-based qPCR | Digital PCR (ddPCR) |
| Measurement principle | Fluorescence binding to all dsDNA | Sequence-specific fluorescent probe | Counting of positive individual reactions |
| Signal generation | Dye binds to dsDNA | Probe is hydrolyzed during amplification | Endpoint measurement of positive droplets |
| Quantification | Relative (via Ct value and standard curve) | Relative (via Ct value and standard curve) | Absolute (via Poisson distribution) |
| Standard curve required | Yes | Yes | No |
| Specificity | Medium (primer-dependent) | High (primer + probe) | High (primer + probe) |
| Measurement timing | During amplification (real-time) | During amplification (real-time) | After endpoint PCR |
| Reaction format | Single reaction volume | Single reaction volume | ~20,000 droplets per well |
| Cost | Low | Medium | High |
| Instrumentation | Real-time PCR system | Real-time PCR system | Droplet generator + thermocycler + droplet reader |
2.4. Sequencing-based Methods
2.4.1. Oxford Nanopore Technology
2.4.2. Illumina Sequencing
While the previously described methods (qPCR, ddPCR) can specifically detect and quantify individual DNA sequences, sequencing-based approaches go a step further: they read the exact order of bases in a DNA or RNA molecule – step by step, letter by letter.
One example of these technologies is nanopore sequencing. In a study by Gunter et al. (Nature Communications 2023), long-read nanopore sequencing was used for the comprehensive analysis of mRNA vaccines. Methods such as „VAX-seq” can capture key quality attributes – including sequence identity, integrity, length, and purity – while simultaneously assessing mRNA and residual DNA. This makes nanopore sequencing a promising analytical approach for manufacturing and quality control processes.
In particular, Oxford Nanopore Technology (ONT) has emerged in recent years as a promising tool for quality control of mRNA-based therapeutics. It provides direct sequence information at the single-molecule level and can analyze both short and very long fragments – a key advantage for the characterization of residual DNA.
⚬ ⚬ ⚬
2.4.1. Oxford Nanopore-Technologie
When nanopore sequencing is mentioned today, it usually refers to the platform developed by Oxford Nanopore Technologies (ONT). Although alternative concepts for nanopore-based sequencing exist, ONT is currently the only technology that is widely commercially available and practically established. Since its market introduction in 2015, it has become established as a representative of so-called third-generation sequencing technologies.
What makes this method special is the direct analysis of individual DNA or RNA molecules in real time. In contrast to classical sequencing approaches, neither cyclic amplification nor chemical labeling of nucleotides is required. Instead, sequence information is derived directly from physical measurement signals.
Functional principle
ONT sequencing is based on the interaction of several key components:
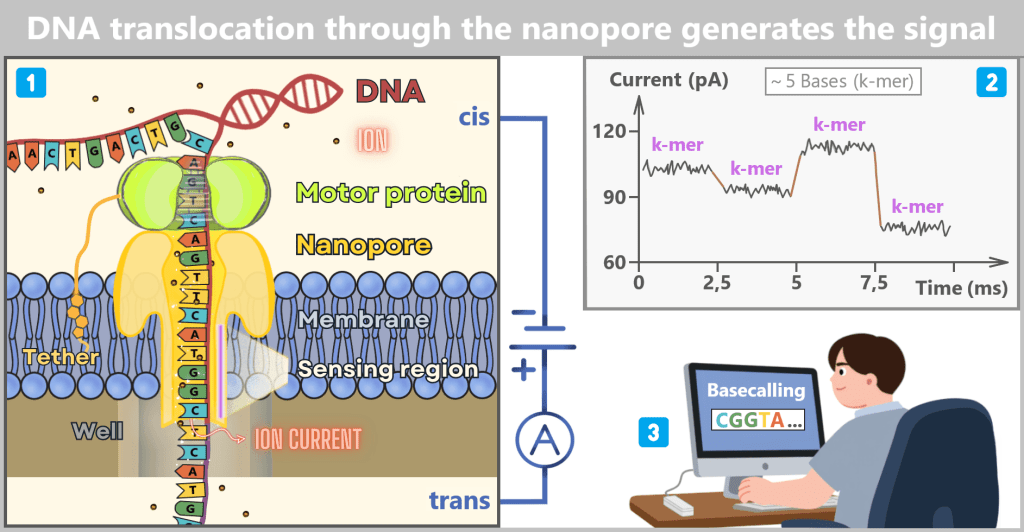
Nanopores – act as tiny molecular „reading units”. When a single DNA or RNA strand passes through a pore, it generates characteristic electrical signals, comparable to a molecular „fingerprint”.
Membrane – serves as a filter and barrier. It ensures that only ions and nucleic acids can pass through the nanopores, while unwanted molecules are excluded. This creates a defined measurement environment for signal detection.
Chip (flow cell) – forms the basis of the system. The chip contains the membrane with numerous nanopores as well as the integrated electronics for signal detection. It represents the functional unit in which sequencing takes place.
System architecture
The chip is divided into two compartments:
| Upper chamber (cis) | This is where the DNA sample is introduced. |
| Lower chamber (trans) | This chamber receives the strand after it passes through the nanopore. |
Both chambers are filled with an ion-containing buffer solution that conducts electrical current. The membrane electrically separates the two chambers – current can only flow at the locations where nanopores are embedded. These pores act as the only „tunnels” through which ions and nucleic acids can pass.
When a constant voltage is applied between the chambers, an ionic current is generated through the nanopores. As a DNA or RNA strand passes through a pore, it causes characteristic changes in this current. These current modulations are continuously recorded and stored as raw electrical signals.
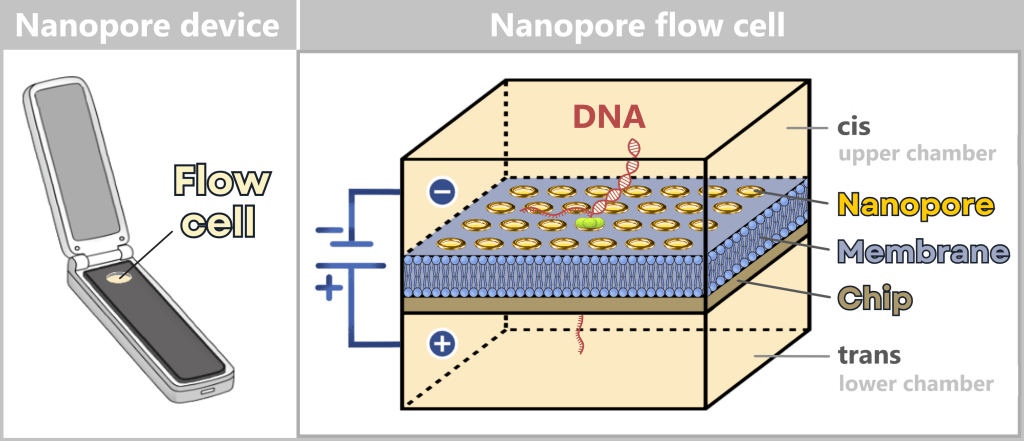
On the left, a portable nanopore sequencing device is shown, approximately the size of a slightly wider USB stick. It contains a replaceable sequencing unit (flow cell) used for the actual analysis.
On the right, a magnified view shows the schematic structure of this sequencing cell: it consists of a chip covered by an electrically insulating membrane. Embedded within this membrane are numerous nanopores that act as molecular sensors. The cell is divided into an upper cis and a lower trans chamber. By applying an electrical voltage, DNA (as shown in the image) is pulled through the nanopore. The resulting changes in ionic current are measured and used for sequence determination.
The path of DNA through the nanopore
1️⃣ Library preparation
Before sequencing can begin, the nucleic acids in the sample (DNA and/or RNA) must be prepared for nanopore sequencing. This step is referred to as library preparation.
In the context of quality control of therapeutic mRNA – for example directly after in vitro transcription or before formulation – the following steps are relevant:
a) Purification
After transcription, the reaction mixture still contains, in addition to the desired mRNA or DNA, enzymes (e.g., polymerases), free nucleotides, and buffer components.
These components must be removed because they can:
- reduce the efficiency of adapter ligation
- block nanopores
- interfere with the electrical signal
In early process stages, thorough purification is therefore required. Shortly before final formulation, however, the product is typically already purified, so no additional bulk purification step is usually necessary.
b) End repair & dA-tailing (for DNA)
If DNA is sequenced – for example to analyze residual DNA fragments – the fragment ends must be prepared.
First, an end repair step is performed: overhanging („sticky”) ends are enzymatically filled in or trimmed back, resulting in blunt-ended double-stranded DNA.
This is followed by a so-called dA-tailing step. In this process, a polymerase specifically adds a single adenine (A) nucleotide to each 3′ end of the DNA. This generates a defined 3′ A-overhang, which is required for the subsequent adapter ligation step.
c) Adapter ligation – the key step
In order for nucleic acids to be recognized by the nanopore and actively guided through it (translocated), specific adapter molecules must be attached (ligated) to their ends.
These adapters are functional modules and contain several essential components:
Motor protein
The motor protein acts as a molecular „brake”. Without this control, DNA would pass through the pore at extremely high speed – far too fast for accurate signal resolution.
The motor protein:
- regulates the translocation speed (~400–500 bases per second)
- ensures a uniform stepping motion
- unwinds double-stranded DNA during passage
Oxford Nanopore uses different motor proteins (helicases) for:
- double-stranded DNA
- cDNA
- native (direct) RNA sequencing
Tether
The tether can be described as a molecular „parking assistant”. It typically contains a cholesterol-like structure that inserts into the lipid membrane of the flow cell. This brings the nucleic acid into close proximity to the membrane surface – exactly where the nanopores are located.
As a result, the likelihood that a molecule enters the electric field of a pore and is captured is significantly increased.
In some protocols, a so-called tether buffer is additionally used to enrich the membrane surface with these anchoring structures.
Barcode sequences (optional)
Barcode sequences enable multiplexing, i.e., the simultaneous analysis of multiple samples in a single sequencing run.
For routine quality control of individual batches, they are not strictly required and are therefore not further considered here.
⬦ ⬦ ⬦
Adapter design in ONT
Oxford Nanopore Technologies provides sequencing adapters that are pre-loaded with the motor protein and tether. During ligation, the entire adapter complex is therefore attached to the nucleic acid molecule.
For DNA:
- The adapter is ligated to the ends of double-stranded DNA.
- The adapters contain an overhanging thymine (T) residue, which is complementary to the previously generated 3′ A-overhang of the DNA.
- This enables efficient and directional ligation.
For RNA (direct RNA sequencing):
- The adapter is ligated to the 3′ end of the RNA, typically via the existing poly(A) tail.
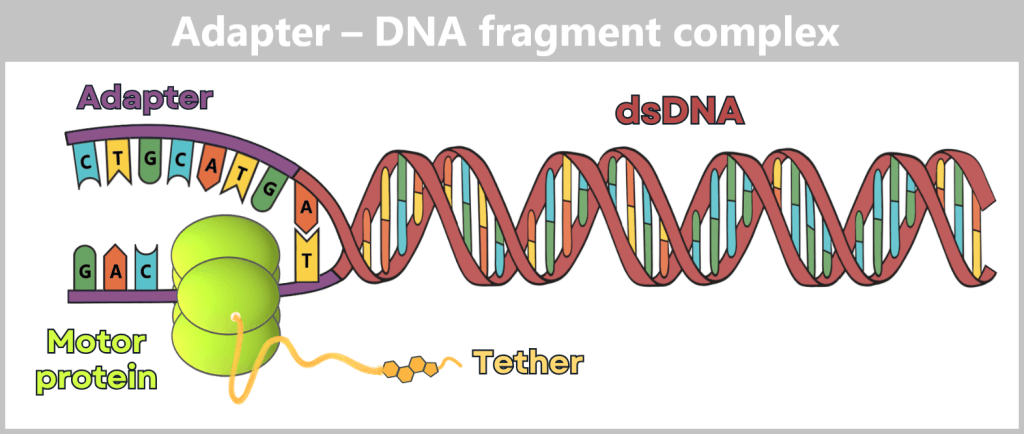
The sequencing adapter contains, in addition to a double-stranded DNA region (typically ~30 to 50 base pairs in length), two short single-stranded sequences (often ~20 to 40 nucleotides). For clarity, the figure shows a strongly simplified representation.
One single strand is already bound inside the motor protein, while parts of the second single strand remain exposed.
Directly adjacent to this is the junction to the actual sample. A specific overhang at the end of the adapter (T) has hybridized with the complementary end of the sample DNA (A). This „ligation” stably links the target double-stranded DNA (dsDNA) to the sequencing system.
Attached laterally to the motor protein is the tether. At its free end is a cholesterol molecule. This acts as a chemical „anchor,” embedding the entire complex into the lipid membrane of the pore, thereby increasing the likelihood that the DNA is captured by a nanopore.
After ligation, the adapters are stably attached to the nucleic acid, and the library is ready for sequencing.
Special feature: Direct RNA sequencing (e.g., in the context of VAX-seq)
A key advantage of nanopore technology is the ability to sequence native RNA directly, without prior conversion into cDNA.
For quality control of therapeutic mRNA, this is particularly important because:
- chemical modifications (e.g., pseudouridine) can be detected directly
- no reverse transcription artifacts are introduced
- structural features of the RNA are preserved
This enables the technology not only to quantify molecules, but also to provide structural and functional characterization at the single-molecule level.
2️⃣ Application of an electrical voltage
Both chambers of the sequencing cell contain charged particles (ions). Once an electrical voltage is applied between the upper cis chamber and the lower trans chamber, an electric field is generated across the membrane. This field drives ions through the nanopores, producing a measurable ionic current.
As long as no DNA is present in the pore, this ion flow remains constant. In this state, the device records a stable baseline current that serves as a reference signal (see following figure).
3️⃣ The DNA is introduced into the sequencing cell
The prepared DNA sample is pipetted into the upper cis chamber of the sequencing cell. Sequencing adapters carrying a motor protein and a tether are already attached to the DNA ends.
At the end of the tether is a hydrophobic (water-repellent) cholesterol group. It functions as a molecular anchor.
Due to diffusion, the DNA strands constantly move within the cis chamber. As soon as the hydrophobic cholesterol randomly contacts the membrane, it immediately adheres to it. Energetically, it is far more favorable for the cholesterol to remain within the lipid layer than in the aqueous buffer.
This mechanism provides two major advantages:
- Concentration at the membrane surface: The DNA molecules accumulate preferentially near the membrane. This increases the probability that the motor protein encounters a nanopore and docks onto it.
- Lateral mobility: The cholesterol is not rigidly fixed within the membrane but remains laterally mobile. The DNA can therefore „slide” along the membrane surface until it is captured by the electric field of a pore and eventually drawn inside.
4️⃣ Docking to the nanopore
Once a single-stranded region of the DNA enters the nanopore, the electric field pulls the negatively charged DNA strand toward the trans chamber. This positions the motor protein against the pore entrance, where it docks stably onto the nanopore.
The electrical force acting on the DNA strand serves as a mechanical trigger for the motor protein. It then begins its helicase activity:
- it unwinds the double-stranded DNA (dsDNA)
- one strand is guided stepwise through the nanopore at controlled speed
- the second strand remains outside the pore
This marks the beginning of the actual sequencing process.
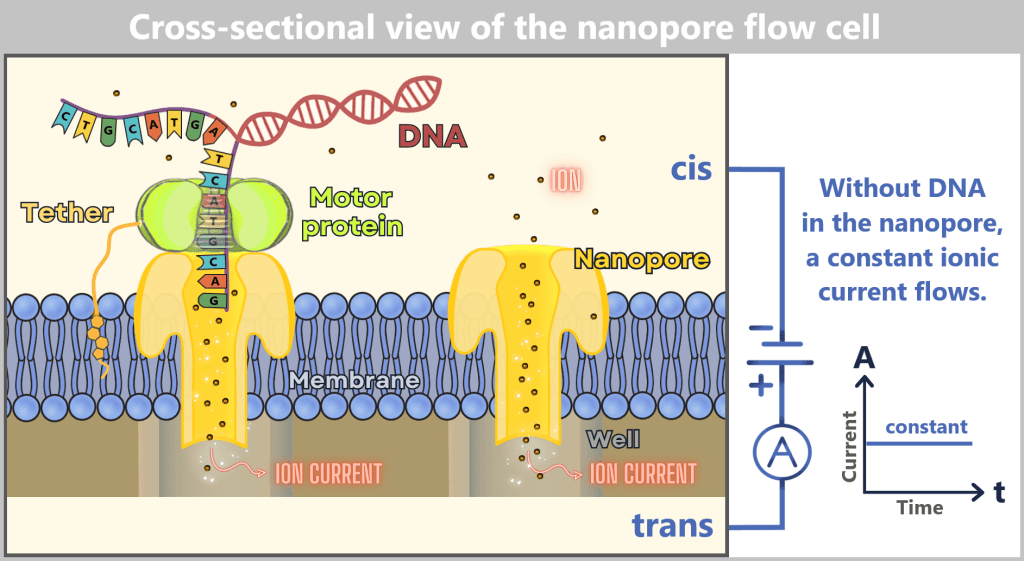
(not to scale)
The sequencing cell consists of two chambers: the cis chamber (top) and the trans chamber (bottom), separated by a membrane containing embedded nanopores. On the left, a DNA molecule is shown docked to a nanopore via a motor protein. On the right, an empty nanopore is depicted through which a constant ionic current flows. The applied voltage between the negative electrode in the cis chamber and the positive electrode in the trans chamber drives the ion flow through the pore. The ionic current is measured in the well (a small channel in the chip beneath the pore), as illustrated in the current-versus-time diagram. As long as no DNA passes through the pore, the current remains constant.
The motor protein – the pacemaker of sequencing
The prepared DNA carries an adapter containing a motor protein (a helicase). Once this complex reaches he vicinity of a nanopore, the protein docks onto the pore entrance like a precisely fitting cap. The electrical voltage within the system acts like an invisible pulling force that draws the DNA into the pore.
This electrical force supports the activity of the motor protein. The protein acts like a wedge that gently pries apart the DNA double strand. The hydrogen bonds between the base pairs – the „rungs” of the DNA ladder – break under this force because they are considerably weaker than the stabilizing interactions within the protein itself. In this way, the double-stranded DNA (dsDNA) is unzipped like a zipper without damaging the chemical backbone of the strands.
At this stage, precise control begins: Inside the motor protein, four to six DNA-binding loops (so-called hairpins or loops) grip the newly exposed single strand (ssDNA). These gripping elements are arranged in a spiral fashion, comparable to the steps of a spiral staircase or the thread of a screw.
The protein can be imagined as a „breathing screw”: Driven by ATP, it rhythmically changes its shape. It contracts and expands repeatedly. During each cycle, the upper gripping elements release the DNA, move one step forward, and reattach further upstream, while the lower elements maintain their grip and push the strand downward into the pore in a controlled manner.
This staircase-like arrangement ensures that the DNA does not shoot uncontrollably through the nanopore, but instead advances step by step – effectively base by base. It is this precise mechanical pacing by the motor protein that allows the nanopore to accurately register the electrical signal generated by each nucleotide.
5️⃣ The DNA passes through the nanopore – signal generation
DNA carries a negative electrical charge due to its phosphate groups. Because of the applied voltage between the negatively charged cis chamber and the positively charged trans chamber, the single strand is pulled through the nanopore.
At this stage, the motor protein performs a crucial role:
- it moves the DNA through the pore stepwise
- thereby greatly reducing the translocation speed
- the movement becomes slow, uniform, and controlled
Without this control, the DNA would pass through the nanopore at speeds of millions of bases per second. The motor protein slows this movement down to approximately 300–450 bases per second. Only this controlled pacing enables reliable signal measurement.
As the DNA strand travels through the pore, it influences the ionic current. Each nucleotide has a slightly different size and chemical structure. These differences alter the current flow in characteristic ways.
The current changes are measured by electrodes connected to the individual wells within the chip. Each well contains a nanopore and has its own measurement unit. This allows the software to assign the recorded signals unambiguously to a specific pore.
6️⃣ The electrical signal is recorded
During sequencing, typically about five to six bases are located simultaneously within the narrowest region of the nanopore. This short DNA segment is referred to as a k-mer. Within the pore channel, the k-mer acts like an electrical resistor: different base combinations influence the ionic current in characteristic ways and therefore generate distinct electrical signals.
The DNA sequence can be reconstructed because the DNA moves stepwise through the pore, with each k-mer producing a characteristic electrical signature. Specialized software analyzes this sequence of current signals using machine learning algorithms that assign the complex signal patterns to the corresponding nucleotide combinations. This process is called basecalling.
In this way, the complete nucleotide sequence is reconstructed step by step from the electrical measurement data.
1) Cross-sectional view of the sequencing cell
A single-stranded DNA molecule is pulled from the cis side toward the trans side due to the applied voltage. The motor protein is positioned above the nanopore. It acts as a molecular brake and controls the forward movement of the DNA. As a result, the single strand is translocated through the pore at a speed of approximately 400 bases per second, allowing each signal to be measured precisely.
At the narrowest constriction of the pore (marked here as the sensing region), several bases are present simultaneously – typically around five nucleotides, referred to as a k-mer. This short DNA segment partially obstructs the pore channel. The ions (small red dots) still attempt to flow through the pore. Because the k-mer reduces the available space, fewer ions can pass through. This generates a characteristic current signal.
2) The data in the current-versus-time plot
The Y-axis shows the ionic current in picoamperes (pA), while the X-axis represents time in milliseconds (ms).
A k-mer typically remains within the narrowest region of the pore for approximately 2–3 milliseconds. During this period, multiple current measurements are recorded for that exact base combination.
This produces a slightly fluctuating plateau in the diagram, caused by electrical noise. The brown connecting lines between the plateaus indicate the moment when the motor protein advances the DNA by one base, thereby moving a new k-mer into the sensing region.
3) Basecalling – conversion of current signals into bases
The characteristic current signals – the plateaus in the current-versus-time plot – each correspond to the electrical signature of a specific k-mer, i.e., a short base combination residing in the sensing region of the pore for a few milliseconds.
Basecalling algorithms, often based on neural networks, analyze this sequence of current signals. From the characteristic signal patterns, they reconstruct the underlying DNA base sequence.
🎥 Tip: The video „How nanopore sequencing works“ provides a clear overview of the process.
⬦ ⬦ ⬦
Result of nanopore sequencing
Nanopore sequencing does not produce a single measurement value, but rather a comprehensive dataset consisting of many individual sequence reads. Each read corresponds to the analysis of a single DNA or RNA molecule. Together, these individual measurements provide a detailed representation of the nucleic acids present in the sample.
In principle, all DNA or RNA molecules contained in the sample can be detected without the need to predefine a specific target sequence. The method is therefore not target-directed, but exploratory in nature.
◈ ◈ ◈
Two key levels of information: identity and quantity
The generated sequencing data contain two complementary levels of information:
Identity (sequence information)
For each individual molecule, the nucleotide sequence can be determined. This provides information about:
- the exact base sequence
- the length of the molecules
- structural characteristics (e.g., full-length molecules or fragments)
- possible sequence variants
- and, with methodological limitations, chemical modifications
On this basis, it can be determined which nucleic acids are present in a sample.
Quantity (relative abundance)
In addition, the number of reads can be used to estimate how frequently certain sequences or molecule types are represented in the sample. However, this does not constitute absolute quantification, but rather a relative approximation influenced by several factors, including:
- efficiency of library preparation
- molecule length
- sequence characteristics
The quantitative interpretability of the method must therefore always be considered in the context of these influencing factors.
✧ ✧ ✧
Parallel single-molecule analysis in real time
Data generation is performed by a large number of nanopores operating in parallel within the so-called flow cell. Devices such as the MinION contain several hundred active measurement channels that function simultaneously and independently.
Each nanopore analyzes one individual molecule at a time. Once a sequencing event is completed, the pore immediately becomes available for the next molecule. In this way, a continuous stream of individual reads is generated.
The measurement is performed in real time, with the software simultaneously recording and processing the signals from many individual pores.
✧ ✧ ✧
Nature of the data: distribution instead of a single value
A key characteristic of nanopore sequencing is that the results are not provided as a single uniform measurement value, but as a distribution of many individual sequencing reads. These reads can differ significantly in:
- length
- sequence
- quality
In complex samples in particular, the dataset typically contains:
- short fragments
- longer contiguous molecules
- different molecular populations
Therefore, analysis does not focus on individual reads in isolation, but on interpreting the overall distribution of all reads.
✧ ✧ ✧
A key feature of the method: long reads
A defining characteristic of nanopore technology is its ability to sequence very long nucleic acid molecules continuously. In contrast to short-read approaches (such as Illumina sequencing), where DNA is first fragmented into short pieces and later computationally reconstructed, nanopore sequencing can directly capture contiguous molecules.
In principle, the length of a read is not limited by the technology, but is mainly determined by the integrity of the source molecule.
This enables, in particular:
- direct analysis of whole molecules
- distinction between intact sequences and fragments
- investigation of structural relationships within individual molecules
✧ ✧ ✧
Limitations and methodological influences
Despite its advantages, nanopore sequencing is subject to several methodological limitations:
Error rate of individual reads
The accuracy of single sequencing reads is lower compared to classical short-read technologies. This is due to the indirect determination of sequence information via electrical current signals. Certain sequence motifs, in particular homopolymeric regions (e.g., long stretches of the same base), can be more difficult to resolve.
Selection and process bias
Not all molecules are captured with equal probability. Differences in length, structure, or adapter ligation efficiency can lead to certain sequences being preferentially or underrepresented in sequencing.
In particular, library preparation can influence the composition of the sequenced molecules. Purification steps using magnetic beads or other size-dependent processes may partially remove or underrepresent very short fragments. At the same time, longer molecules are often sequenced more efficiently in nanopore systems, as they remain in the pore longer and generate more stable signals.
As a result, the observed read distribution does not necessarily reflect the original fragment distribution of the sample.
Dependence on sample quality
The quality and integrity of the starting nucleic acids significantly influence the resulting reads. In particular, long molecules are prone to fragmentation during sample preparation.
✧ ✧ ✧
Consensus building and bioinformatic analysis
To increase the accuracy of the results, the data are not interpreted on the basis of individual reads. Instead, many sequencing reads of the same molecule type are compared and merged into a consensus sequence.
Since sequencing errors are mostly randomly distributed, they can be largely reduced through this repeated analysis. Modern basecalling and analysis methods, which are often based on machine learning, further contribute to improving sequence accuracy.
In this way, a large number of individual measurements can be combined to produce a consistent and reliable overall representation.
✧ ✧ ✧
Context for nucleic acid analysis
Nanopore sequencing therefore enables a detailed characterization of nucleic acids with regard to their sequence, length, and relative abundance. At the same time, the interpretation of the data requires consideration of methodological influences, particularly with respect to quantification and the representativeness of the molecules that are detected.
2.4.2. Illumina sequencing
Nanopore sequencing enables the analysis of long, contiguous molecules in real time – its particular strength lies in capturing full-length sequences without necessarily fragmenting them into short standard fragments beforehand. A different approach is taken by Illumina sequencing: instead of working with individual long molecules, it analyzes a very large number of short fragments in parallel with high precision. Both technologies complement each other – they answer different questions using different methods.
Illumina sequencing is a short-read approach and belongs to the group of so-called next-generation sequencing (NGS) technologies.
It is currently the most widely used sequencing method worldwide. The underlying principle differs fundamentally from nanopore technology: while ONT passes individual molecules through a pore and measures electrical signals in real time, Illumina relies on an optical method – sequencing by synthesis using fluorescently labeled nucleotides. In this process, DNA is not read directly but decoded step by step during a controlled synthesis reaction.
Operating principle
1️⃣ Preparation of DNA fragments = library construction
For sequencing, DNA must first be converted into a format suitable for the Illumina platform. This process is also called library preparation and consists of the following steps:
a) Fragmentation
DNA is mechanically or enzymatically broken into smaller pieces (typically with a target size of about 150–500 base pairs). This generates fragments of slightly different lengths, which are often further standardized using size-selection methods.
This step is particularly important when long DNA molecules are to be sequenced, since Illumina technology processes short fragments more efficiently than very long contiguous molecules.
In some applications, fragmentation can be deliberately reduced or omitted – especially when already highly fragmented DNA is analyzed. However, even in such approaches, very long fragments (typically above ~800–1000 bp) are often less efficiently processed during library preparation and sequencing, and may therefore be underrepresented.
To illustrate this, we consider three DNA fragments of slightly different lengths in our example.
b) Adapter ligation
Specific adapter sequences (P5 and P7 adapters) are attached to both ends of the DNA fragments. These adapters serve several functions:
Flow cell binding sites: The adapters contain specific DNA sequences that act like a key fitting into a lock, allowing fragments to attach to a surface required for sequencing.
Primer binding sites: The adapters include regions where sequencing primers can bind. These primers are later used to synthesize DNA strands step by step.
Indexes (optional): If multiple samples are sequenced simultaneously, index sequences allow the assignment of fragments to their respective samples. For clarity, indices are not shown in this example.
c) PCR amplification
To ensure that sufficient DNA is available for sequencing, the adapter-ligated DNA fragments are amplified using the polymerase chain reaction (PCR).
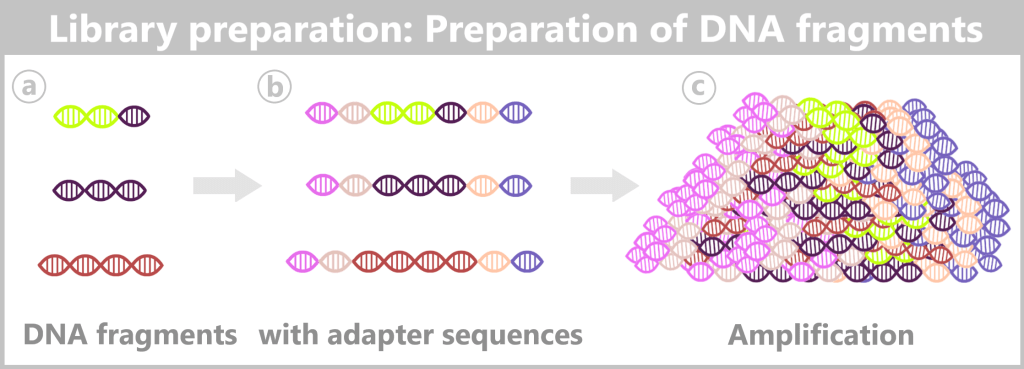
The following close-up shows a detailed representation of a fragmented double-stranded DNA molecule with both adapters attached.
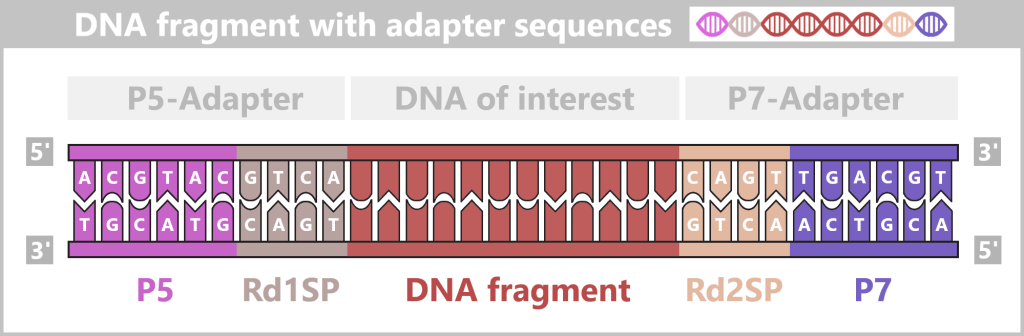
Each DNA fragment receives two adapter sequences: the P5 adapter contains the P5 adapter sequence, which enables binding to the flow cell, and the Rd1SP (Read 1 Sequencing Primer) binding site to initiate DNA synthesis. Similarly, the P7 adapter contains the P7 adapter sequence for flow cell binding as well as the Rd2SP (Read 2 Sequencing Primer) binding site for the initiation of DNA synthesis.
This representation is highly simplified. In practice, Illumina adapter sequences are significantly longer (typically 60–120 base pairs). The DNA fragment itself is also shortened for clarity; in reality, DNA fragments typically range from 100–500 base pairs in length.
2️⃣ Cluster generation on a flow cell
The core of Illumina technology is the so-called flow cell – a glass-like surface coated with millions of short, immobilized DNA binding sites.
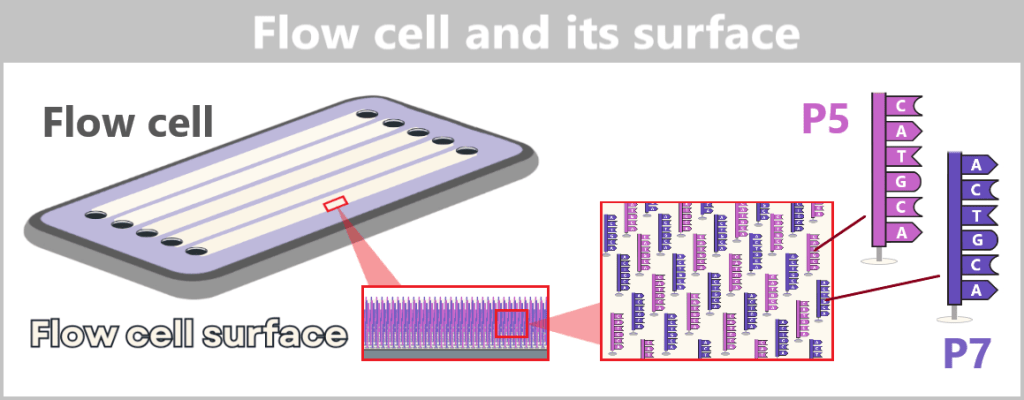
a) DNA fragments bind to the flow cell surface
At the beginning of this step, a solution of single-stranded DNA fragments is passed over the flow cell. The fragments carry the previously ligated adapter sequences at their ends and have been denatured into single strands, allowing them to exist freely in solution.
As the fragments flow across the flow cell, their adapters bind via complementary base pairing to matching DNA oligonucleotides on the surface.
To illustrate this, the flow cell surface can be imagined as a dense Velcro-like system: the adapter sequences of the DNA fragments adhere to complementary binding sites on the flow cell – similar to small hooks anchoring into a Velcro mesh.
b) First synthesis
After the DNA fragments have bound to the flow cell, the first DNA synthesis begins. A primer binds to the adapter sequence of the immobilized single strand. The DNA polymerase then synthesizes a complementary strand.
In the next step, the original template strand is removed, while the newly synthesized strand remains attached to the flow cell.
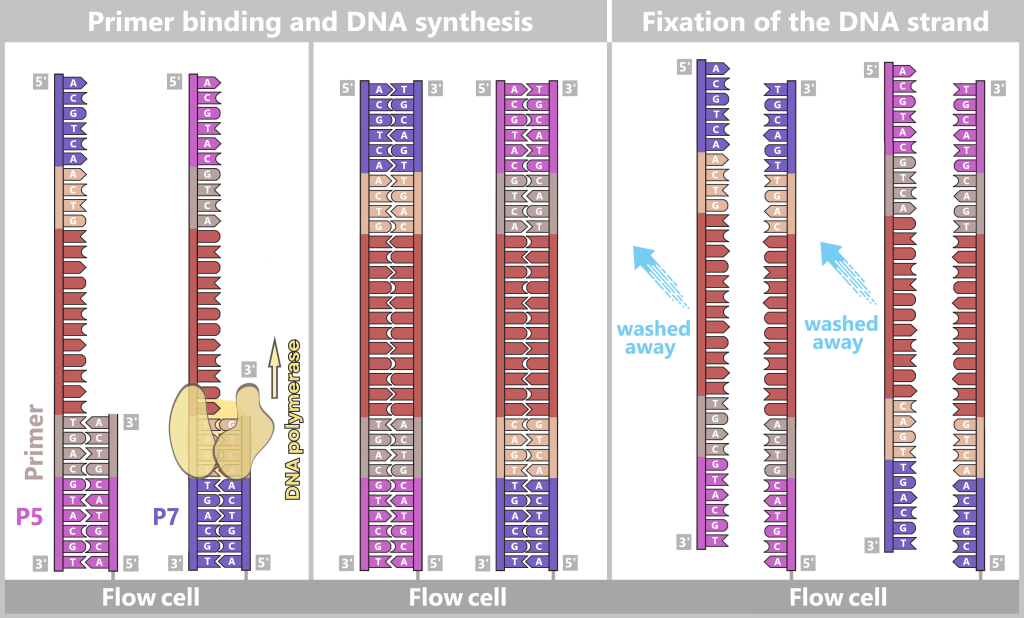
Left: Primers bind to the adapters (P5, P7), and DNA polymerase (DNAP) initiates synthesis of a new complementary strand.
Middle: DNA polymerase synthesizes the first new strand.
Right: The resulting DNA double strand is denatured. After separation, the original template strand is no longer attached to the flow cell and is washed away. The newly synthesized strand remains firmly bound to the flow cell via its 5′ end.
At this stage, direct sequencing would not yet be feasible, as the fluorescence signals from individual molecules would be too weak to be reliably detected. Therefore, a process called bridge amplification follows.
c) Bridge amplification
To ensure that subsequent sequencing generates a sufficiently strong fluorescence signal, the DNA molecules bound to the flow cell must first be amplified.
The process begins when a surface-bound single-stranded DNA molecule, due to its flexibility, bends back toward the surface and hybridizes via its free adapter end to a neighboring complementary binding site on the flow cell. This forms a characteristic bridge structure.
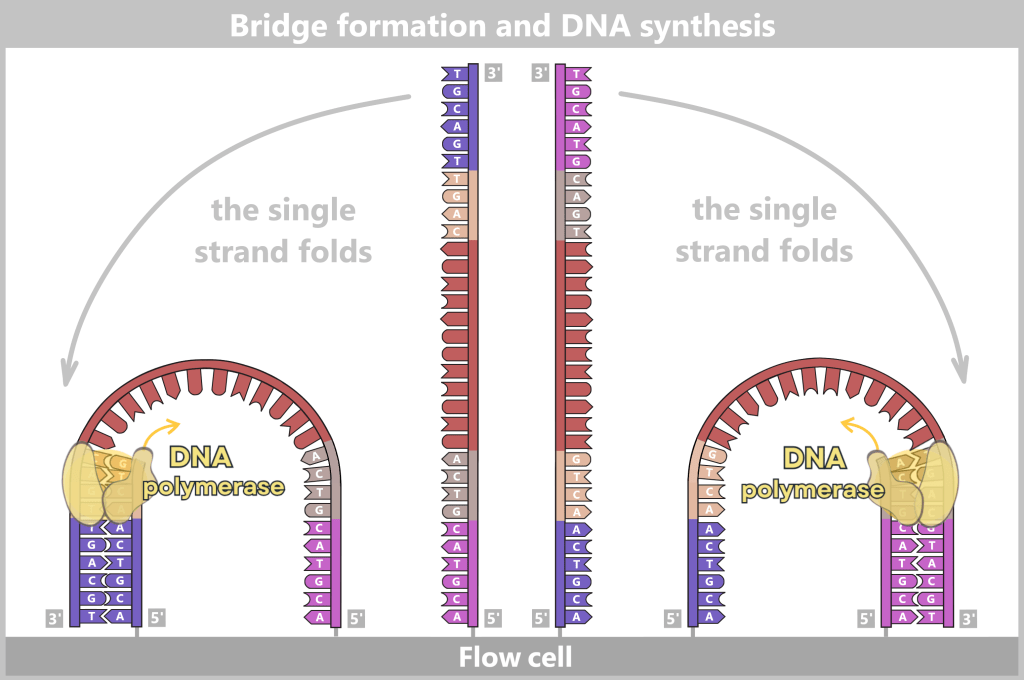
The surface-anchored single strands fold and bind to adjacent anchors on the flow cell, forming a bridge structure. This is followed by the initiation of the copying process.
Subsequently, DNA polymerase synthesizes a complementary strand along the bound template strand. After synthesis, the bridge structure is denatured again, resulting in two single strands that are both firmly anchored to the flow cell.
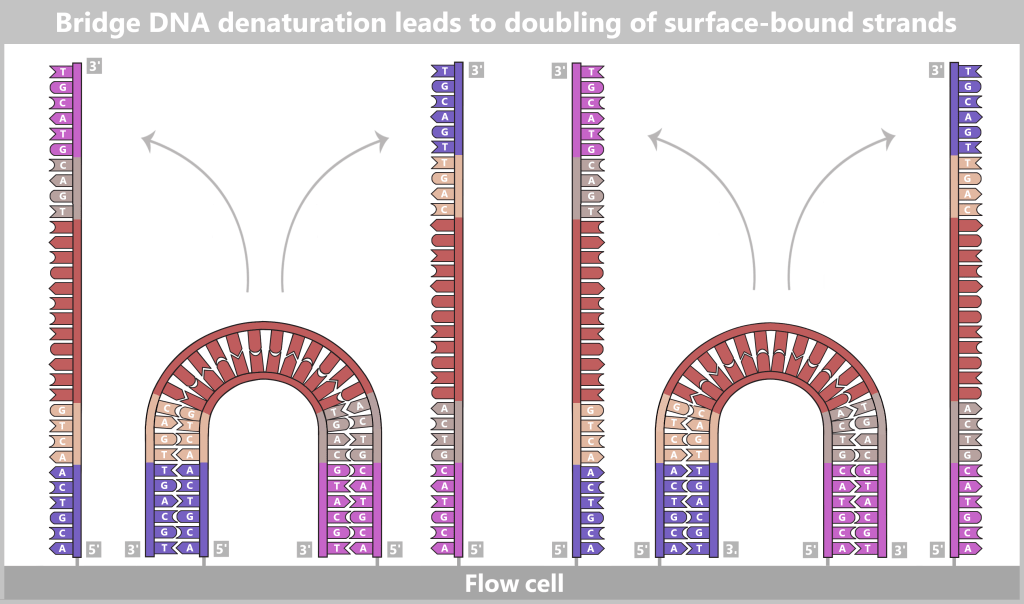
After the replication process, the bridge double-stranded DNA structures are denatured. As a result, the number of surface-bound DNA strands is doubled. These strands are now ready for further amplification.
This process is repeated multiple times. With each cycle, the number of surface-bound DNA molecules doubles.
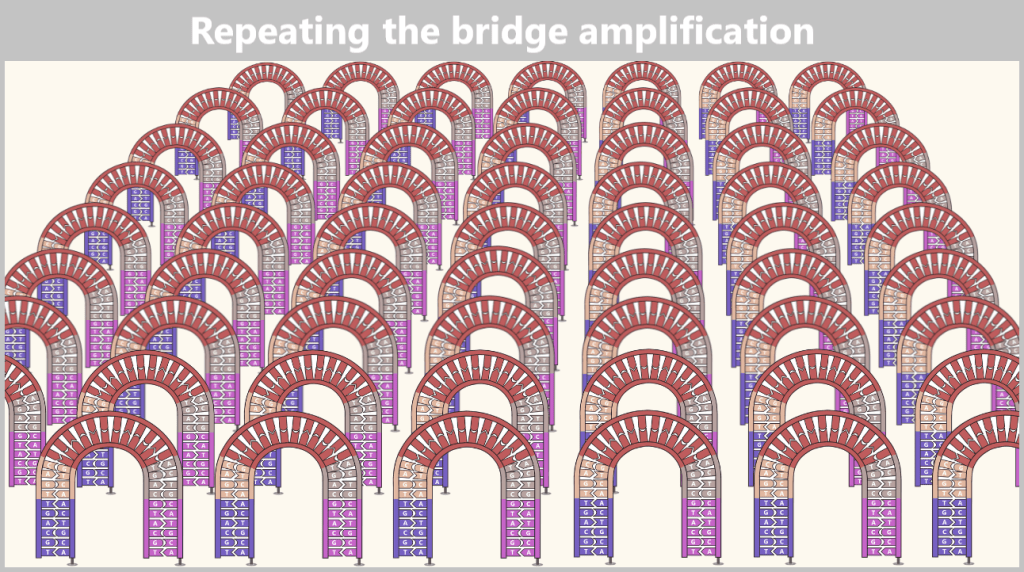
In this way, locally confined clusters consisting of millions of nearly identical copies of a single original DNA fragment are formed.
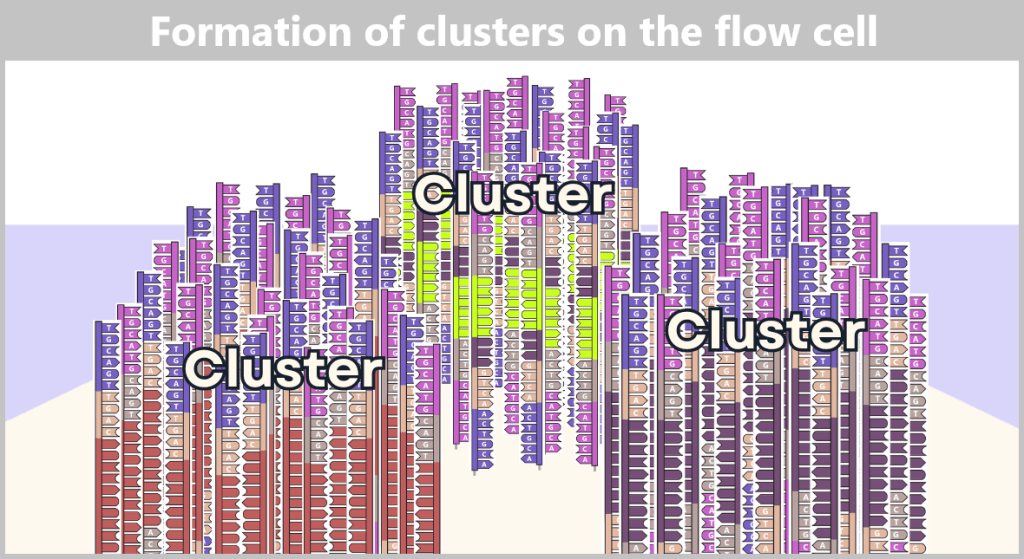
In this illustration, only three clusters are shown as examples. In reality, however, millions of such clusters are present on a flow cell, enabling a high sequencing throughput.
The result is a densely packed surface of millions of spatially separated DNA clusters, each consisting of many nearly identical copies of a single original DNA fragment. This enables millions of different sequences to be analyzed in parallel.
Without this amplification, reading DNA would be like trying to detect a single firefly in the wind. The clusters, however, make the DNA bases (A, T, C, G) clearly detectable – like a glowing neon sign in the dark.
Removal of one strand type
To ensure that sequencing proceeds in a synchronous and unambiguous manner, the DNA strands within each cluster must be oriented uniformly. Therefore, one of the two strand types is selectively removed prior to the actual sequencing step.
The unnecessary complementary strands are chemically cleaved and washed away. At the same time, certain free ends on the flow cell are blocked to prevent unwanted re-binding or further amplification.
After this process, the clusters consist of many single strands with identical orientation. The DNA library is now prepared for the actual sequencing step.
3️⃣ Sequencing by synthesis
To initiate sequencing, primers, DNA polymerases, and modified nucleotides are added to the flow cell. Each of the four nucleotides (A, T, G, and C) carries a distinct fluorescent label as well as a reversible chemical blocking group.
The primers hybridize to the DNA strands of the library. DNA polymerase then binds to the primer and begins synthesizing the complementary strand.
Because of the reversible blocking group, only a single nucleotide can be incorporated during each cycle. After incorporation, DNA synthesis temporarily stops.
The flow cell is then imaged using high-resolution cameras. The fluorescence color emitted by each cluster indicates which nucleotide was incorporated during that cycle. Analysis software interprets these signals and converts them into the corresponding base sequence.
Subsequently, excess nucleotides are washed away. In an additional chemical step, both the fluorescent label and the blocking group of the incorporated nucleotide are removed, allowing the next synthesis cycle to begin.
This process repeats cycle by cycle. In this way, the sequence of each DNA fragment is read out step by step.
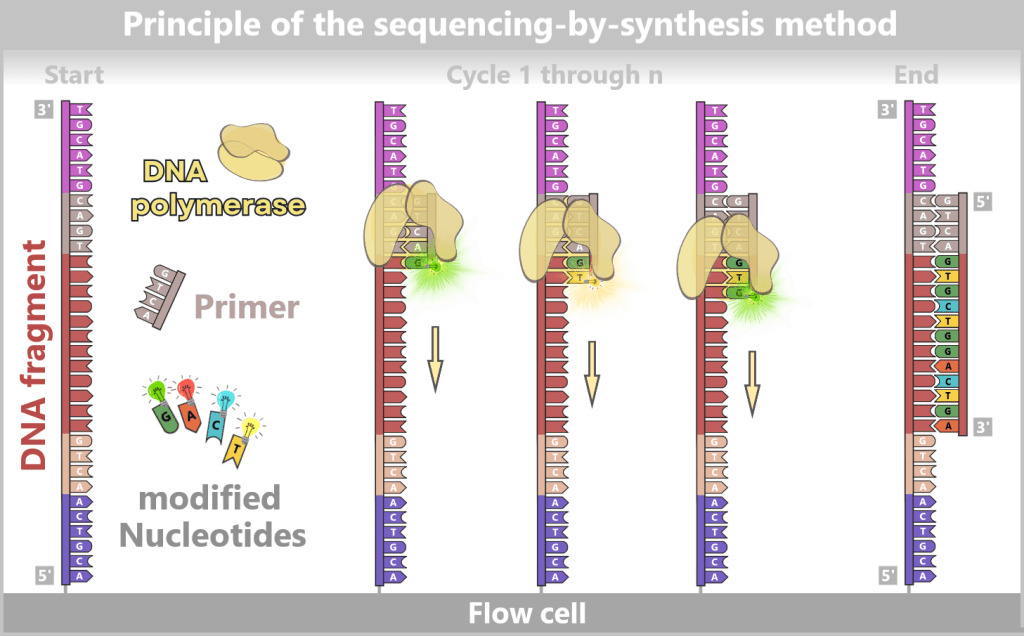
4️⃣ Datenauswertung
After completion of sequencing, millions of individual fluorescence signals are available. These raw data are first translated into nucleotide sequences by the instrument software. The result consists of short sequence fragments, referred to as reads.
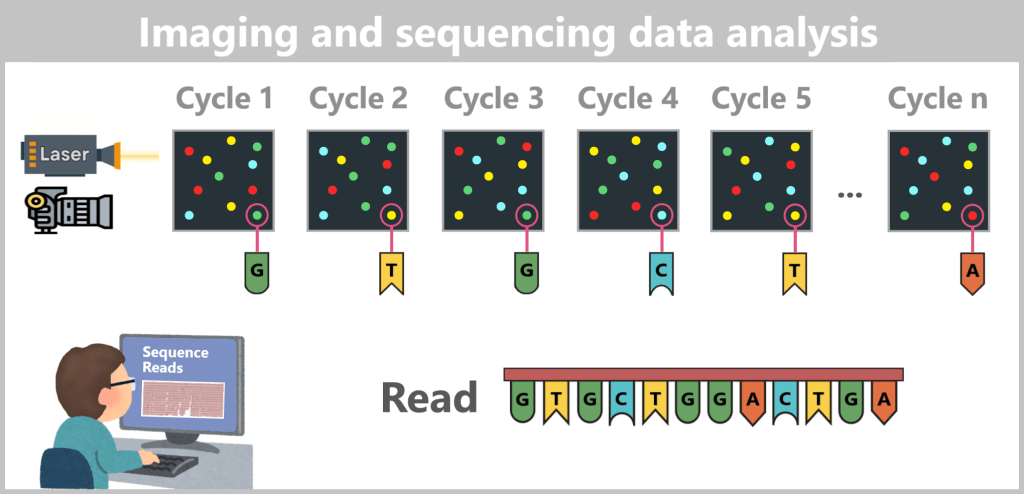
🎥 Tip: A more detailed yet illustrative explanation of the Illumina sequencing technology can be found in the video „Illumina Sequencing Technology“.
⬦ ⬦ ⬦
Quality control and trimming
In the first step, the quality of the reads is assessed. Bases with low signal quality – typically located at the ends of reads – are removed (trimming). This reduces incorrect sequence assignments and improves the reliability of downstream analysis.
Mapping: alignment to a reference sequence
Next, the reads are compared to known reference sequences, such as the vaccine manufacturer’s plasmid or bacterial reference genomes. Specialized algorithms (e.g., BWA-MEM or Bowtie2) search for matches and assign each read to its most likely position within the reference sequence.
This allows determination of which sequences are present in the sample and their potential origin.
Determination of fragment lengths
In commonly used paired-end sequencing, each DNA fragment is read from both ends. The distance between the two reads allows estimation of the original fragment length.
This information is particularly important for analyzing fragmented DNA samples.
Identification of DNA origin
By comparing the sequencing data with reference databases, it can be determined whether the detected fragments originate from, for example:
▪️the expected production plasmid
▪️bacterial sequences
▪️or other genetic sources
This allows Illumina sequencing to provide not only quantitative information but also a detailed characterization of the DNA present in a sample.
Data normalization
The number of generated reads depends, among other factors, on sequencing depth. To enable comparison between different samples or batches, the data are often normalized, for example as reads per million (RPM). This makes it possible to better assess relative differences between samples.
◈ ◈ ◈
Methodological limitations
Limited suitability for absolute quantification
Illumina sequencing is highly effective for identifying DNA fragments and analyzing their relative abundance. However, direct absolute quantification of the original DNA amount is only possible to a limited extent.
This is because library preparation itself can alter the composition of the sample. Steps such as PCR amplification, adapter ligation, or size selection may preferentially enrich or deplete certain fragments. As a result, the number of reads generated is not necessarily proportional to the original abundance of DNA fragments in the sample.
Bias in fragment length distribution
In short-read sequencing, DNA fragments within a certain size range are preferentially analyzed. Very short fragments may be lost during purification, while very long fragments may be disadvantaged during amplification and cluster formation.
Therefore, the observed fragment length distribution does not necessarily reflect the original distribution in the sample, but rather the distribution of successfully sequenced fragments.
2.5. Electrophoretic Fragment Analysis
Electrophoretic fragment analysis is an established standard method in molecular biology for separating and characterizing nucleic acids (DNA and RNA). Depending on the application, it can provide information on several key parameters:
- Size (fragment length): reported in base pairs (bp) for DNA or nucleotides (nt) for RNA
- Quantity: semi-quantitative estimation of the amount of nucleic acid present
- Integrity: degree of fragmentation or molecular integrity
The method is based on the physical principle of electrophoresis (movement under the influence of an electric field). Charged molecules such as DNA or RNA are driven through a supporting medium (typically a gel or a polymer-based matrix) by an electric field. Due to their negatively charged phosphate backbone, nucleic acids migrate toward the positively charged electrode.
Separation is achieved through the pore structure of the medium: smaller fragments move more rapidly through the network, while larger molecules are more strongly retarded. This results in a size-dependent separation of nucleic acids.
In the context of residual DNA analysis in mRNA-based pharmaceuticals, this method is particularly useful for estimating fragment length distributions and therefore complements both quantitative and sequencing-based detection approaches.
2.5.1. Agarose gel electrophoresis
2.5.2. Automated systems
⚬ ⚬ ⚬
2.5.1. Agarose gel electrophoresis
Agarose gel electrophoresis is the classic and most widely used form of electrophoretic fragment analysis of DNA. It is used to separate nucleic acids according to their size and make them visible.
System setup
The central component is a gel made of agarose, a polysaccharide-based network derived from algae. This gel forms a three-dimensional matrix with pores of defined size. The pore size can be controlled by the agarose concentration: low concentrations produce larger pores (suitable for long DNA fragments), while higher concentrations produce smaller pores (for short fragments).
The gel is embedded in a buffer solution and placed in an electrophoresis chamber. At both ends of the chamber are electrodes (cathode/anode), between which a constant electrical voltage is applied.
Before electrophoresis begins, the samples are pipetted into small wells at the edge of the gel.
In complex samples, such as those obtained after in vitro transcription and enzymatic treatment (e.g., DNase I), RNA and remaining DNA fragments can migrate through the gel simultaneously. For targeted analysis of residual DNA, the sample is therefore often additionally treated with RNase, so that predominantly DNA fragments are visible. This allows a clearer assessment of the fragment length distribution.
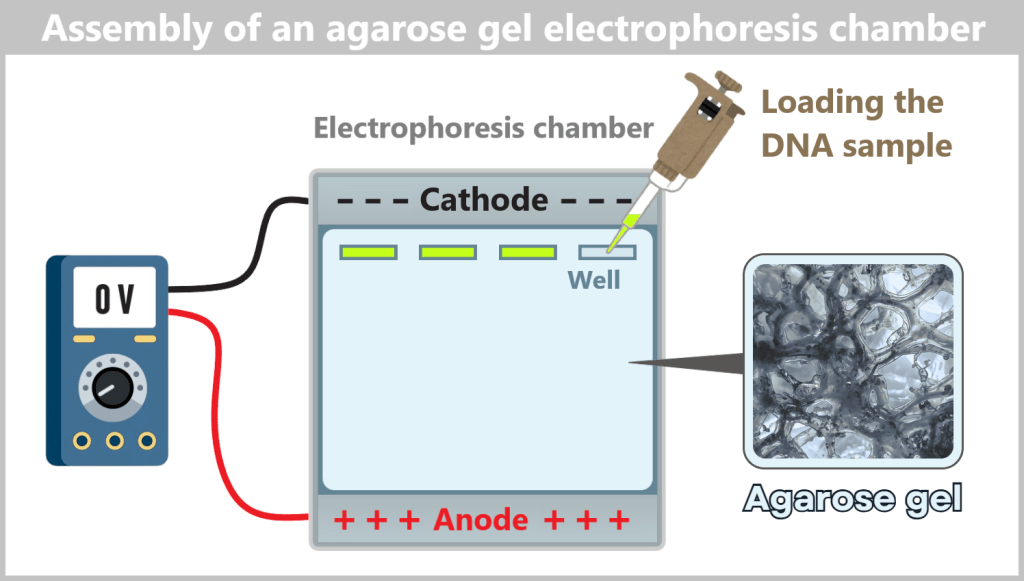
Principle of operation
DNA molecules carry a negative charge due to their phosphate groups. When an electric voltage is applied, they begin to migrate through the gel toward the positively charged electrode.
During migration, two opposing forces act on the molecules:
- the electric force, which pulls the DNA through the gel
- the mechanical resistance of the gel matrix
Since smaller DNA fragments are less hindered by the pore structure, they move through the gel faster than larger fragments. This results in a size-dependent separation of the molecules along the direction of migration.
For size determination, a so-called DNA ladder (marker) with known fragment lengths is run in parallel. By comparing the migration distances, the sizes of the unknown fragments can be estimated.
Visualization and analysis
After electrophoresis, the DNA fragments are initially invisible. Visualization of the DNA is achieved using fluorescent dyes, which are either added to the gel before electrophoresis or applied to the gel afterward. Both methods are well established and differ mainly in their influence on migration behavior and the experimental effort required.
The gel is removed from the electrophoresis chamber and placed on a transilluminator. Under UV or blue light, the fluorescent dyes bound to the DNA appear as bands in the gel.
By comparing the bands with the simultaneously run marker, the sizes of the DNA fragments can be estimated. In addition, the intensity of the bands allows a rough semiquantitative assessment of the amount of DNA present.
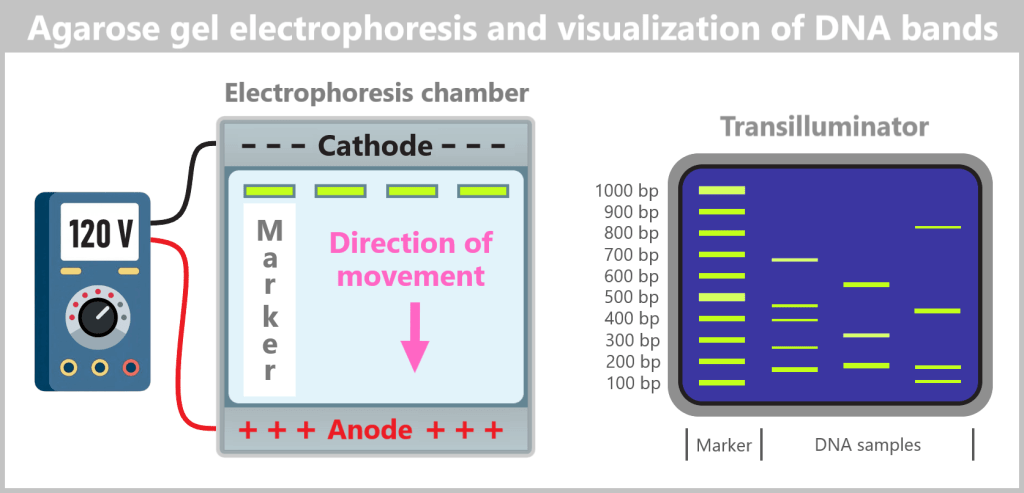
🎥 Tip: The video „Electrophoresis explained“ briefly summarizes the principle of agarose gel electrophoresis.
2.5.2. Automated Systems
Automated electrophoretic systems represent a further development of classical agarose gel electrophoresis. They are based on the same physical principle of size-dependent separation of nucleic acids in an electric field, but combine it with microfluidic technology, integrated detection, and digital analysis.
In contrast to manual gel preparation, separation is carried out in miniaturized, prefabricated systems. The samples are loaded into specialized cartridges or chips containing fine channels filled with polymer matrices. Within these microstructures, the nucleic acids are separated electrophoretically under an applied voltage.
During the run, the fragments are continuously detected using fluorescent dyes. The signals are directly converted into digital data and displayed as so-called electropherograms. Instead of bands in a gel, peaks are generated, where the position indicates the fragment size and the height or area reflects the relative amount of nucleic acid.
Commonly used systems include:
- the Bioanalyzer
- the TapeStation
- and the Fragment Analyzer
These systems differ in details such as throughput, sensitivity, and degree of automation, but they follow a comparable basic principle.
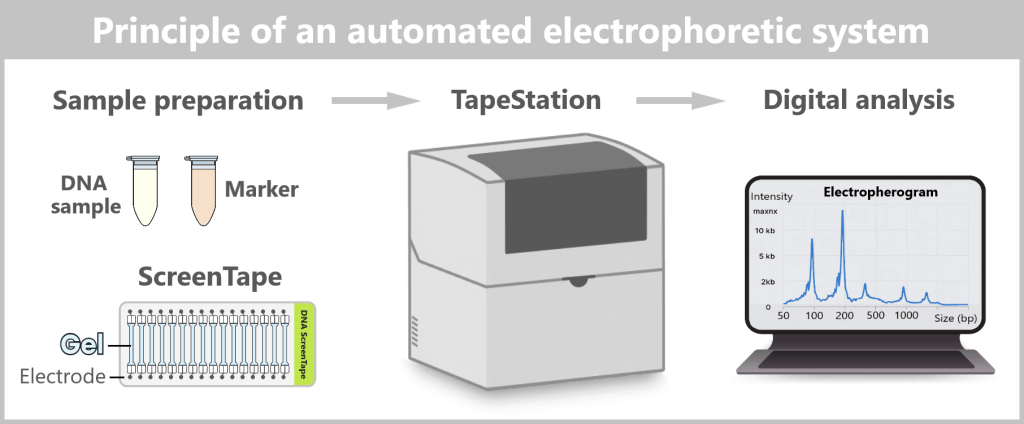
Workflow of an automated electrophoretic system (e.g., TapeStation)
1) Sample preparation
The samples to be analyzed are pipetted into tubes or a microtiter plate (e.g., 96-well format) and mixed with a kit-specific buffer. In parallel, a reference standard (ladder/marker) with defined fragment sizes is prepared.
2) Addition of fluorescent dye
A fluorescent dye is added to the samples, which binds selectively to DNA or RNA and enables subsequent detection.
3) Provision of the separation medium
The separation medium is a so-called ScreenTape – a prefabricated microfluidic system containing an integrated gel matrix and multiple parallel separation channels. Depending on the application, specific ScreenTapes are used for DNA or RNA.
4) Automated electrophoresis run
Samples, marker, and ScreenTape are loaded into the instrument. After startup, the system performs the analysis automatically: the samples are sequentially transferred into the separation channels and electrophoretically separated under an applied voltage.
5) Detection and data analysis
During separation, fluorescent signals from the nucleic acids are optically detected (e.g., using a laser). The software processes these signals into digital outputs, including:
▫️electropherograms (peak-based representations of fragment sizes)
▫️size distributions
▫️and semi-quantitative concentration measurements
🎥 Tip: A visual demonstration of the operating principle of the TapeStation system and ScreenTape technology is provided in the following video „Agilent 2200 TapeStation System“.
⬦ ⬦ ⬦
Advantages of automated systems
Automated systems offer several key advantages over classical agarose gel electrophoresis:
- Higher sensitivity: even small amounts of nucleic acids can be detected
- Improved reproducibility: standardized cartridges and automated workflows reduce experimental variability
- Quantifiability: in addition to fragment size, relative concentration can be estimated more accurately
- Digital analysis: objective and reproducible evaluation without visual interpretation of gel images
In addition, these systems often provide further metrics, such as average fragment lengths or integrity indices, enabling a standardized assessment of sample quality.
⬦ ⬦ ⬦
DNA- and RNA-specific assays
A key aspect of automated systems is the use of specific assays for different types of nucleic acids. In complex samples, separate analyses are therefore often performed, in which identical samples are analyzed using either DNA- or RNA-specific reagents.
These assays differ, among other things, in:
- the composition of the polymer matrix
- the fluorescent dyes used
- the data analysis algorithms
In this way, DNA and RNA fragments can be characterized independently, even if they were originally present in the same sample.
⬦ ⬦ ⬦
Interpretative value of electrophoretic fragment analysis
Electrophoretic fragment analysis primarily provides structural information about nucleic acids. In the context of quality control of mRNA-based products, it is particularly useful for:
- analyzing the fragment length distribution of DNA and RNA
- assessing RNA integrity
- distinguishing between highly fragmented and largely intact nucleic acids
- identifying dominant fragment sizes
- and detecting residual DNA fragments
◈ ◈ ◈
Limitations of electrophoretic fragment analysis
Both classical agarose gels and automated electrophoretic systems have methodological limitations, particularly when detecting low levels of residual DNA in complex samples.
- No sequence information: The method separates nucleic acids solely based on size or electrophoretic mobility. It cannot determine whether a fragment originates from genomic DNA, plasmid DNA, mRNA, or nonspecific degradation products.
- Limited sensitivity compared to amplification-based methods: Very small amounts of residual DNA may fall below the detection limit. Techniques such as qPCR or ddPCR are significantly more sensitive for quantifying trace DNA levels.
- Limited resolution for highly fragmented DNA: Highly degraded DNA often appears as a diffuse signal region („smear”), making individual fragments difficult to characterize.
- No information on biological functionality: The method only shows fragment size and quantity distribution. Whether DNA fragments are still biologically active, complete, or potentially transcription-competent remains unknown.
- Dependence on dye binding and fragment size: Very short fragments may bind less dye and can therefore be underestimated or even go undetected. Quantitative accuracy is especially limited at the lower end of fragment sizes.
- Overlapping signals in complex samples: In samples containing both RNA and DNA, signal regions may overlap. Despite specific assays, misassignments or background signals cannot be fully excluded.
- No absolute quantification of specific target sequences: The method does not allow targeted measurement of defined DNA sequences. Specific identification of residual process DNA is therefore only possible in combination with sequence-specific techniques.
Overall, electrophoretic fragment analysis primarily provides structural information on nucleic acids and complements quantitative and sequencing-based methods by offering insights into fragment size, integrity, and distribution, but it cannot replace sequence-specific or functional assays.
2.6. Comparison of Key Detection Methods for Nucleic Acids
The quantitative and qualitative determination of nucleic acids forms the foundation of numerous molecular biological analyses. However, depending on the method, both the informational content and the limitations of the measurement differ significantly. None of the established techniques provides a complete picture – instead, they complement each other.
UV spectroscopic measurements determine the total amount of nucleic acids in a sample by measuring the absorption of UV light at 260 nm. This method is fast and straightforward, but it does not distinguish between different DNA or RNA sequences. Contaminants such as proteins or other molecules can also influence the signal.
Fluorometric methods use specific dyes that preferentially bind to DNA or RNA. As a result, they are significantly more selective and sensitive than UV-based measurements. Nevertheless, they do not provide information about the exact sequence or origin of the nucleic acids – they only quantify the amount of specific classes of molecules present.
Electrophoretic fragment analysis adds a structural perspective to these methods. It allows the estimation of fragment sizes, fragment length distributions, and the integrity of DNA or RNA. This makes it possible, for example, to distinguish between intact and highly fragmented nucleic acids. However, the method does not provide sequence information and does not allow the unambiguous identification of specific DNA or RNA molecules.
PCR-based methods (qPCR and ddPCR) enable highly sensitive and specific detection of defined DNA sequences. By using sequence-specific primers, individual regions of the genome can be selectively amplified and quantified. However, this high specificity is also a limitation: only those sequences for which appropriate primers have been designed can be detected. Unknown or unexpected sequences remain undetected.
Another methodological limitation arises from the requirements regarding DNA integrity. For amplification to occur, both primer binding sites must be fully contained within a DNA fragment. qPCR amplicons are typically 80–150 base pairs in length. Highly fragmented DNA, in which fragments are shorter or in which one of the primer binding sites is missing, cannot be amplified. In other words, only DNA fragments that span the complete target region between both primers are detectable by qPCR.
This dependence on fragment length is particularly relevant when DNA has been broken down by enzymatic or mechanical processes, such as DNase I treatment during the removal of residual DNA in mRNA production. For successful qPCR/ddPCR, however, both primers – forward and reverse – must be able to bind to the same fragment. The shorter the fragments, the lower the probability that a fragment contains both primer binding sites – an important consideration when assessing residual DNA.
Illumina sequencing is based on the parallel sequencing of many short DNA fragments. It provides highly accurate sequence data with a very low error rate compared to other sequencing methods, making it particularly suitable for the precise analysis of known or referenceable sequences. However, the method requires more complex sample preparation, PCR-based library amplification, and advanced bioinformatic analysis. In addition, it typically sequences only relatively short fragments, which makes it more difficult to capture larger structural relationships.
Nanopore sequencing goes one step further: it enables the direct determination of the base sequence of individual DNA or RNA molecules in real time. As a result, unknown sequences can also be identified, and very long fragments can be analyzed. In addition, the technology allows, under certain conditions, the direct detection of chemical nucleic acid modifications. However, the resulting data require careful bioinformatic analysis and, compared to Illumina sequencing, currently still show higher error rates.
⚬ ⚬ ⚬
The following overview summarizes the most important detection methods, their measurement principles, as well as their specific strengths and limitations in the context of mRNA production.
Method
What is measured?
Strengths
Weaknesses / limitations
Typical application
UV spectroscopy
Total concentration of all nucleic acids
Fast and simple, no reagents required, low cost
No distinction between DNA, RNA, and free nucleotides; sensitive to contamination
Rapid rough estimation of concentration and purity
Fluorometry
DNA or RNA via dye binding
High sensitivity, tolerant to contaminants
No sequence information
Precise quantification of target RNA
Qubit fluorometer
DNA or RNA via dye binding (fluorometric device)
Very high sensitivity and selectivity, reproducible results
No sequence information, higher cost than basic fluorometry
Standardized concentration measurement in lab and GMP settings
qPCR
Specific DNA sequences (e.g., template DNA, host cell DNA)
High sensitivity, sequence-specific
Only known target sequences detectable; depends on primer design and amplification efficiency; quantification requires standard curve; susceptible to inhibitors
Detection of residual DNA
ddPCR
Absolute copy number of specific DNA sequences
Absolute quantification without standard curve, very high precision, more robust against inhibitors
Only known target sequences detectable; depends on primer/probe design and target integrity; higher cost; more complex sample preparation
Precise quantification of defined DNA target sequences in validation assays
Agarose gel electrophoresis
DNA/RNA fragments by size
Simple, cost-effective, visual estimation of fragment size and integrity
Low resolution, semi-quantitative, not suitable for precise concentration measurement, no sequence information
Rapid quality control, integrity assessment
Automated electrophoresis
Size, concentration, and integrity of DNA/RNA
High resolution, quantitative, reproducible, low sample input
Higher cost, requires consumables
RNA integrity assessment (RIN score), fragment analysis of residual DNA
Illumina sequencing (NGS)
Sequence information of many short DNA/RNA fragments
Very high accuracy, broad coverage, well established
Short reads (150–300 bp), complex sample preparation, requires bioinformatic analysis
High-resolution sequence analysis and characterization of residual nucleic acids
Nanopore sequencing
Full DNA/RNA sequence of individual molecules
Direct sequence information, long reads, real-time data, detects unknown sequences and structural variants
Higher error rate, complex analysis, still less established in GMP environments
Characterization of complex nucleic acid populations, identity testing, integrity analysis
Overall, it becomes clear that each method has its own specific strengths and weaknesses. The choice of the appropriate procedure therefore always depends on the respective research question.
This is particularly true for the quality control of therapeutic mRNA. Active ingredient concentration, purity, and potential contaminants each place distinct demands on the analytical method.
No single method can answer all analytical questions – only the combination of quantification, structural characterization, and sequence information enables a comprehensive assessment of nucleic acids.
◈ ◈ ◈
Combined application of methods
In practical analytical work, the methods described are rarely used in isolation. Instead, the characterization of nucleic acids is typically performed using a combination of complementary techniques. For example, UV spectroscopic measurements can be used for a rapid estimation of concentration and purity, while fluorometric methods enable more selective quantification. PCR-based methods such as qPCR or ddPCR are applied to specifically detect and quantify defined DNA sequences. Sequencing approaches such as Illumina or Nanopore technologies complement these analyses by directly determining the sequence and enabling the identification of unknown sequences or structural variants.
⬦ ⬦ ⬦
Regulatory classification
In a regulatory context, quality control of therapeutic nucleic acid products requires the use of validated and standardized analytical methods. PCR-based techniques such as qPCR and ddPCR are well established for this purpose and are routinely used for the quantification of defined residual DNA sequences. Sequencing-based approaches, including Nanopore technology, are gaining increasing importance; however, in many application areas they are still in the phase of methodological establishment and validation.

3. Guidelines for Limiting Residual DNA in Vaccines
Residual DNA (residual DNA), including host cell DNA or plasmid DNA, refers to nucleic acid remnants from the manufacturing process that may remain in the final product after purification. As outlined in previous chapters, complete removal of this DNA cannot be achieved technically; therefore, low residual amounts are considered an unavoidable component of biotechnological products.
The development of regulatory guidelines for limiting residual DNA has progressed in parallel with advances in biotechnological manufacturing processes. The aim of these requirements is to minimize potential biological risks. These include in particular:
- Oncogenicity
- Insertional mutagenesis
- Immunogenicity
- and, in certain contexts, infectivity (e.g., in viral systems)
Historical development
Early phase: precaution-oriented approach
With the introduction of recombinant DNA technologies (methods in which DNA from different organisms is deliberately combined) in the 1980s – such as for the production of therapeutic insulin or growth hormones – the need to systematically evaluate residual DNA emerged for the first time.
At that time, there were considerable scientific uncertainties regarding the biological effects of exogenous DNA. In particular, it was unclear under which conditions foreign DNA could integrate into the genome of human cells and potentially induce oncogenic effects.
Against this background, regulatory authorities adopted a conservative, precaution-oriented approach. In the 1980s, the World Health Organization (WHO) recommended a limit value of 10 pg residual DNA per dose for products derived from continuous cell lines (cells that are capable of unlimited division in the laboratory). This value was not based on a quantitative risk assessment but represented a pragmatic guideline aligned with the analytical capabilities available at the time.
Later evaluations led to an upward revision of this value; by the mid-1980s, levels on the order of approximately 100 pg per dose were already considered negligible.
Paradigm shift: from mass to biological activity
In the 1990s and 2000s, the regulatory perspective changed fundamentally. Two developments were primarily responsible for this:
First, manufacturing and purification processes improved significantly. Methods such as chromatography, filtration, and enzymatic treatment enabled a reproducible reduction of residual DNA by several orders of magnitude.
Second, experimental studies increasingly provided quantitative insights into the biological activity of DNA. It became evident that not only the total amount is relevant, but that structural properties such as length and integrity of DNA play a central role.
Longer, intact DNA fragments containing functional gene segments can, under suitable conditions, theoretically exert biological effects. However, this potential decreases significantly with increasing fragmentation. Short DNA fragments have a strongly reduced probability of entering the cell nucleus, persisting stably, or being integrated into the genome.
For actual integration of exogenous DNA into a cellular genome, several conditions must be met simultaneously. These include, among others, uptake of the DNA into the cell, its transport into the nucleus, and the presence of suitable cellular mechanisms for stable integration. The likelihood of all these conditions occurring simultaneously under natural physiological conditions in the body is considered low and decreases further with increasing DNA fragmentation.
Modern regulatory approaches
Based on these findings, modern regulatory concepts have evolved toward a risk-based and product-specific approach. Instead of a single universal limit value, several complementary requirements are now central:
| Requirement | Rationale |
| Validated elimination | The manufacturing process must demonstrably and reproducibly contribute to the reduction of residual DNA. |
| Fragmentation | Remaining DNA should be present in a highly fragmented form whenever possible. |
| Product-specific limits | Acceptance criteria are defined depending on the manufacturing process, cell line, and intended use. |
Regulatory guidelines issued by organizations such as the U.S. Food and Drug Administration (FDA), the European Medicines Agency (EMA), and the International Council for Harmonisation (ICH) today largely follow this differentiated approach.
✧ ✧ ✧
Classification in the context of modRNA-based vaccines
For modRNA-based vaccines, fundamentally similar regulatory principles apply as for other biotechnologically manufactured medicinal products. At the same time, manufacturing processes and product characteristics differ in certain aspects, particularly due to in vitro transcription and the use of synthetic RNA.
In the context of vaccines, regulatory guidelines regarding residual DNA content for parenteral administration (i.e., administration by injection or infusion that bypasses the gastrointestinal tract) are often oriented toward the nanogram range per dose.
In addition, it is required that any remaining DNA be highly fragmented and not contain functionally complete genes. In the scientific literature, fragment lengths below a few hundred base pairs (bp) are frequently discussed in this context, although no uniform threshold has been established. These requirements reflect the current regulatory approach, which takes into account both the quantity and the structural properties of DNA.
The following table summarizes the key regulatory documents in which limits for residual DNA are specified.
| Document | Statement / Context |
| 1998 – WHO TRS 878, Annex 1 | Historical source: first mention of <10 ng/dose for continuous cell lines. |
| 2007 – WHO Study Group on Cell Substrates for the Production of Biologicals | Discussion of <10 ng/dose in the context of highly fragmented DNA (e.g., <200 bp). |
| 2013 – WHO TRS No. 978 | Confirms <10 ng/dose as an established standard; emphasizes the importance of fragmentation and manufacturing process; key WHO document on cell substrates. |
| 2014 – WHO TRS 987, Annex 4 | <10 ng/dose (in the context of recombinant protein therapeutics) |
| 2020 – FDA CMC Guidance (Gene Therapy) | <10 ng/dose and <200 bp (for gene therapy products derived from continuous non-tumorigenic cell lines) |
| 2020 – Rapporteur Rolling Review critical assessment report (Josephson 2020-11-19) | Acceptance criteria: ≤ 330 ng DNA/mg RNA (derived from 10 ng/dose at 30 µg RNA per dose). |
| 2024 – WHO TRS 1062, Annex 1 (not yet public) | Recommendations for mRNA vaccines – expected to include similar order-of-magnitude ranges. |
Dose: Total amount of the medicinal product administered per application.
ng/dose (nanograms per dose): A measure of the permissible amount of residual DNA per dose.
bp (base pairs): A measure of the length of DNA fragments.
⚬ ⚬ ⚬
Conversion of measurement values to ng per dose
In order to compare measurement results from different studies with regulatory guideline values, a standardized reference unit is required. While regulatory limits are usually expressed as an amount per dose (ng/dose), analytical measurements are often reported relative to the RNA quantity (e.g., ng DNA per mg RNA).
For comparability, these values must be converted accordingly.
Basic principle:
DNA (ng/dose) = DNA (ng/mg RNA) × RNA amount per dose (mg)
Example calculation
Assume that an analytical measurement yields: 330 ng DNA per mg RNA
and the administered dose contains: 30 µg RNA = 0,03 mg RNA
The calculation is therefore: 330 ng/mg × 0,03 mg = 9,9 ng DNA per dose
This example demonstrates that concentration-based values (ng/mg RNA) and dose-related limits (ng/dose) can be directly converted into one another, provided that the underlying RNA amount per dose is known.
The result is therefore in the range of 10 ng DNA per dose, corresponding to the commonly cited regulatory guideline value.
⚬ ⚬ ⚬
Classification
An important aspect of regulatory classification is that no single universally binding limit applies to all modRNA vaccines. Instead, the evaluation is based on a combination of general recommendations, product-specific specifications, and risk-based principles.

4. Experimental Studies on residual DNA in mRNA-based Vaccines
Following the presentation of manufacturing processes, potential impurities, and analytical detection methods, the central question arises as to the extent to which residual DNA can actually be detected in commercial mRNA vaccines.
Since 2023, several independent investigations have been published addressing the detection, quantification, and characterization of DNA in different vaccine batches.
The aim of this chapter is to present the studies published to date, classify their methodological approaches in a comprehensible manner, and summarize the reported findings.
4.1. Why independent measurements?
4.2. Methodological preliminary remarks
4.3. Overview and individual analysis of the studies
4.4. Interim conclusion: What do we know – and what do we not know?
⚬ ⚬ ⚬
4.1. Why independent measurements?
The approval of a medicinal product requires the manufacturer to demonstrate compliance with regulatory quality standards to the competent authorities. For mRNA-based vaccines, this includes, among other things, ensuring that residual amounts of DNA remain below established limit values. The corresponding analytical data are submitted as part of the regulatory approval process and are evaluated by the authorities.
What this process does not structurally provide for is systematic verification by independent laboratories after market authorization. Authorities such as the EMA or FDA base their assessments primarily on the data submitted by the manufacturer. Independent reanalysis of commercially available batches is not part of the standard procedure.
This is precisely where independent research becomes relevant. Since 2023, several research groups –without affiliation to the manufacturers – have investigated commercially obtained batches of mRNA vaccines for residual DNA. The primary motivation was not necessarily the expectation of a problem, but rather a fundamental question of scientific reproducibility: Can the quality data submitted during the regulatory approval process be reproduced through independent measurements?
The results of these studies have not been uniform – neither with respect to the measured quantities nor the methodological approaches employed. Some groups reported DNA levels exceeding regulatory guideline values, whereas others arrived at different conclusions or raised methodological concerns regarding the analytical procedures used.
This chapter presents the most important of these investigations. Its purpose is not to provide a final assessment – the scientific discussion is still ongoing – but rather to offer an objective overview of the available findings, the methods applied, and the remaining open questions.
4.2. Methodological preliminary remarks
Before presenting the individual studies, a methodological framework is helpful – not to anticipate results, but to provide the reader with a tool for interpreting the findings.
The studies presented in this chapter originate from independent laboratories and differ in some cases significantly with regard to their methodological approaches and the detection methods employed.
The dispersion of lipid nanoparticles
Every analysis begins with the same fundamental challenge: the nucleic acids to be measured – mRNA and potential residual DNA – are encapsulated within lipid nanoparticles (LNPs). To make them analytically accessible, the particles must first be disrupted.
In the studies considered, a variety of methods were used for this purpose. Detergents such as Triton X-100 chemically dissolve the lipid membrane. Combinations of lithium dodecyl sulfate (LiDS) and magnetic SPRI beads enable both particle disruption and selective purification of nucleic acids. Thermal approaches – such as heating to 95 °C – destabilize particle structure through heat exposure. Commercial kits such as the Monarch Plasmid DNA Miniprep Kit combine multiple steps into a standardized protocol.
This methodological diversity is not trivial. Three aspects deserve particular attention:
First, the methods differ in their disruption efficiency: not every approach fully opens all particles. If intact LNPs remain in the sample, their contents remain inaccessible to downstream measurement, which can lead to an underestimation of the actual DNA content.
Second, some methods may alter or degrade the released molecules. Thermal disruption at high temperatures can fragment RNA in particular; DNA is more thermally stable but may also be affected under certain conditions. As described in Chapter 2.6, highly fragmented DNA is less accessible to PCR-based detection methods – short fragments may no longer contain both primer binding sites and therefore escape detection.
Third, residues of certain reagents can interfere with subsequent analytical steps. Detergents such as Triton X-100 are known PCR inhibitors. If they are not fully removed, amplification efficiency may be reduced, again leading to an underestimation of the measured quantity. SPRI beads, on the other hand, select based on fragment size: very short DNA fragments may be lost during this step.
Choice of analytical method
Following sample disruption, the actual measurement is performed. Here too, the studies differ considerably. Some research groups used quantitative PCR methods (qPCR), which enable highly sensitive but sequence-specific detection. Others employed sequencing approaches – either nanopore technology (ONT) or the Illumina platform – which provide a broader, sequence-independent overview but require more complex data analysis. In some cases, fluorometric methods were also used for total quantification.
Each of these methods measures slightly different aspects: fluorometry detects total DNA irrespective of sequence but can be affected by interference from RNA (cross-talk). PCR-based methods detect only predefined target sequences. Sequencing approaches provide a broader picture but are more strongly influenced by library preparation, fragment selection, and bioinformatic processing. As a result, direct comparability of absolute quantitative values across studies using different methodologies is only limited.
Validation and standardization
In regulated pharmaceutical analysis, analytical methods must be validated before use: extraction efficiency, limit of detection, linearity, and potential sources of interference must be systematically determined. The independent studies presented here generally lack this formal validation – which does not mean that the work was carried out carelessly, but rather that methodological uncertainties are more difficult to quantify.
A direct comparison of the same sample using multiple methods in parallel – a so-called orthogonal approach – would help to distinguish method-related variability from true differences between batches. Only a subset of the available studies systematically applies multiple orthogonal methods to the same samples. The importance of this approach will be addressed again in the concluding chapter.
4.3. Overview and individual analyses of the studies
The following studies differ in terms of methodology, form of publication, and scientific classification. In addition to peer-reviewed articles, preprints and exploratory analyses are also included in order to fully capture the current spectrum of available data.
The presentation is organized chronologically to allow the development of the scientific discussion to be followed in a coherent manner.
Sequencing of bivalent Moderna and Pfizer mRNA vaccines reveals nanogram to microgram quantities of expression vector dsDNA per dose
Authors: Kevin McKernan, Yvonne Helbert, Liam T. Kane, Stephen McLaughlin
Published: 2023 April 10
DNA fragments detected in monovalent and bivalent Pfizer/BioNTech and Moderna modRNA COVID-19 vaccines from Ontario, Canada: Exploratory dose response relationship with serious adverse events.
Authors: David Speicher, J. Rose, L. M. Gutschi, D. M. Wiseman, Kevin McKernan
Published: 2023 October 19
Methodological Considerations Regarding the Quantification of DNA Impurities in the COVID-19 mRNA Vaccine Comirnaty®
Authors: Brigitte König, Jürgen O. Kirchner
Published: 2024 May 8
Confirmation of the presence of vaccine DNA in the Pfizer anti-COVID-19 vaccine
Authors: Didier Raoult
Published: 2024 November 12
BioNTech RNA-Based COVID-19 Injections Contain Large Amounts Of Residual DNA Including An SV40 Promoter/Enhancer Sequence
Authors: Ulrike Kämmerer, Verena Schulz, Klaus Steger
Published: 2024 December 3
A rapid detection method of replication-competent plasmid DNA from COVID-19 mRNA vaccines for quality control.
Authors: Tayler J. Wang, Alex Kim, Kevin Kim
Published: 2024 December 29
Quantitative Analysis of Nucleic Acid Content in Spikevax (Moderna) and BNT162b2 (Pfizer) COVID-19 Vaccine Lots
Authors: Richard M Fleming PhD, MD, JD; Peter Kotlár MD; Sona Pekova MD, PhD
Published: 2025 May 13
Quantification of residual plasmid DNA and SV40 promoter-enhancer sequences in Pfizer/BioNTech and Moderna modRNA COVID-19 vaccines from Ontario, Canada
Authors: David Speicher, Jessica Rose, Kevin McKernan
Published: 2025 September 25
Systematic analysis of COVID-19 mRNA vaccines using four orthogonal approaches demonstrates no excessive DNA impurities
Authors: Adam Achs, Tatiana Sedlackova, Lukas Predajna, Jaroslav Budis, Maria Bartosova, Vladimir Zelnik, Diana Rusnakova, Martina Melichercikova, Marta Miklosova, Veronika Gencurova, Barbora Cernakova, Tomas Szemes, Boris Klempa, Juraj Kopacek, Silvia Pastorekova
Published: 2025 Dezember 13
🧬 🧬 🧬
4.3.1. McKernan et al. (2023)
| Sequencing of bivalent Moderna and Pfizer mRNA vaccines reveals nanogram to microgram quantities of expression vector dsDNA per dose Authors: Kevin McKernan, Yvonne Helbert, Liam T. Kane, Stephen McLaughlin Published: April 10, 2023 (Preprint, OSF) Link to study: https://osf.io/preprints/osf/b9t7m |
a) Context and objective of the study
The study by McKernan et al. is among the first publicly available independent analyses in which mRNA-based COVID-19 vaccines were specifically tested for the presence of DNA. The study was not initiated by regulatory concerns, but rather as an exploratory sequencing project during which DNA was detected in the samples. This prompted the authors to systematically investigate the composition of the vaccines further.
The aim of the study was to:
- detect DNA components in the vaccines,
- estimate their quantity, and
- characterize their sequence identity.
b) Materials and methods
Vaccine lots
The following batches were used for the analyses:
- 2 batches of bivalent Pfizer vaccines (expired)
- 2 batches of bivalent Moderna vaccines (expired)
- 8 batches of monovalent Pfizer vaccines (expired, unopened)
The study combines several analytical methods to enable both quantitative and qualitative assessments.
Disruption of LNPs and nucleic acid extraction
The lipid nanoparticles were lysed using lithium dodecyl sulfate (LiDS). Subsequent purification was performed using the SPRI principle (magnetic beads), which selectively binds nucleic acids in a size- and condition-dependent manner while separating them from lipids and other accompanying substances. The resulting eluate contained isolated nucleic acids – mRNA and potentially present DNA.
As a quality control step for the extraction process, a Bioanalyzer was used. This system applies automated capillary electrophoresis to visualize the size distribution and relative quantity of the recovered nucleic acids.
Sequencing using Illumina
The extracted nucleic acids were analyzed using Illumina sequencing. Multiple sequencing runs (reads) formed the basis for the bioinformatic reconstruction of the plasmid sequences of both vaccines. From the obtained reads, plasmid maps were generated for Moderna and for Pfizer.
PCR-based verification
Based on the sequencing data, specific primers were designed for two target regions: a spike probe and an origin-of-replication (Ori) probe, both targeting sequences present in both the Pfizer and Moderna plasmids. This qPCR analysis was not intended for primary quantification but rather for independent confirmation that the plasmid sequences identified by sequencing were indeed present in the samples – and not attributable to laboratory contamination.
Fluorometry and electrophoresis
Qubit fluorometry and Agilent electrophoresis were used to estimate DNA concentration. Both methods provide information on the total amount of DNA present, but do not yield any sequence information.
c) Key findings
Qualitative findings
The sequencing analyses revealed sequence matches with known plasmid vector sequences and identified genetic elements associated with the manufacturing process. The detected DNA was characterized as double-stranded DNA (dsDNA).
Unexpected finding: SV40 promoter/enhancer
During the sequencing analysis, the authors identified an SV40 promoter/enhancer sequence in the Pfizer vaccine. This finding was considered unexpected because the sequence was not shown in the publicly available plasmid maps submitted to the European Medicines Agency (EMA), specifically in the Rapporteur Rolling Review Critical Assessment Report (Figure S.2.3-1, pST4-1525 Plasmid Map). The authors further noted that the Pfizer plasmid also contains an SV40 nuclear localization signal (NLS), which, in theory, could facilitate the transport of DNA into the cell nucleus.
Quantitative findings
Qubit fluorometry and electrophoresis measurements indicated DNA concentrations that, according to the authors‘ assessment, substantially exceeded commonly cited regulatory guideline values, including the EMA-derived specification of 330 ng DNA per mg RNA.
d) Interpretation by the authors
The authors conclude that residual DNA is present in the analyzed vaccine batches and that its origin is most likely attributable to the plasmid vectors used during the manufacturing process. In their view, the measured quantities may be of regulatory relevance.
With regard to replicable DNA, the authors suggest that stricter limits would be appropriate for such sequences than for non-replicable DNA fragments.
e) Methodological limitations
The origin, storage conditions, and batch characterization of the analyzed vials are documented only to a limited extent. Information on negative controls – such as water samples subjected to the same processing workflow – as well as positive controls containing known DNA concentrations is largely absent or incompletely described. Furthermore, no formal method validation was reported.
Furthermore, the authors themselves point out two opposing sources of uncertainty in quantification: PCR-based methods may underestimate the actual amount of DNA, as fragments shorter than the amplicon length are not detected. Conversely, fluorometry and electrophoresis may overestimate the DNA concentration if the dye used also binds non-specifically to RNA.
f) Contextualization
The study represents an early and significant contribution to the scientific debate on residual DNA in mRNA vaccines. It has played a key role in encouraging other research groups to conduct their own investigations. The findings should be regarded as a starting point for further research, not as a definitive assessment.
🧬 🧬 🧬
4.3.2. Speicher et al. (2023)
| DNA fragments detected in monovalent and bivalent Pfizer/BioNTech and Moderna modRNA COVID-19 vaccines from Ontario, Canada: Exploratory dose response relationship with serious adverse events. Authors: David Speicher, Jessica Rose, L. Maria Gutschi, David M. Wiseman, Kevin McKernan Published: October 19, 2023 (ResearchGate) Link to study: https://osf.io/preprints/osf/mjc97_v1 |
a) Context and Objective of the Study
The study by David J. Speicher builds conceptually on the previously published analyses by Kevin McKernan and pursues a broader approach.
In addition to detecting and quantifying residual DNA in further vaccine batches, it addresses two additional research questions:
- Localization of the DNA: Is the detected DNA located within the lipid nanoparticles (LNPs), or is it present freely in solution?
- Exploratory correlation: Is there a statistical correlation between measured DNA levels and reported adverse events at batch level?
The study is therefore divided into two conceptually distinct parts:
- analytical section: Detection and characterisation of DNA in vaccine samples
- exploratory section: Investigation of a possible statistical relationship with adverse reaction data
Both parts require a different methodological assessment.
b) Materials and Methods
Vaccine batches
A total of 27 vials from 12 batches were examined: 8 expired, unopened Pfizer-BNT162b2 vials and 16 expired, unopened Moderna Spikevax vials, obtained from various pharmacies in Ontario, Canada. All vials were original sealed with intact protective caps and labeled batch numbers and expiration dates. In addition, three still-valid residual volumes from a Moderna XBB.1.5 batch were included. Storage and transport were carried out under documented refrigerated conditions. A sterile, unopened vial of an unrelated medication (TriMix) served as a negative control.
The authors combine several analytical and statistical methods.
Disruption of lipid nanoparticles (LNPs)
To disrupt the lipid nanoparticles (LNPs), the samples were heated for 8 minutes at 95 °C, followed by cooling to 4 °C for five minutes. This thermal step is intended to release the nucleic acids contained within the nanoparticles.
Quantification by qPCR
DNA concentrations were determined using qPCR based on the Cq value (quantification cycle) and converted into nanograms per dose. The authors adopted the primers from the McKernan study: a Spike probe and an Ori probe targeting sequences common to both vaccines (Pfizer and Moderna). In addition, an SV40 enhancer assay was used, specifically designed to detect the SV40 sequence identified in the Pfizer plasmid.
Quantification by Qubit fluorometry
For total DNA quantification, Qubit fluorometry with the DNA-specific dye AccuGreen was used. Fluorescence intensity is proportional to the amount of DNA present and provides a sequence-independent but structure-sensitive overall estimate (dependent on dye specificity and sample composition).
Size profile of residual DNA using ONT sequencing
The size distribution of DNA fragments in a Pfizer sample was determined using Oxford Nanopore sequencing. It should be noted that the library preparation method used systematically removes fragments smaller than approximately 150 base pairs (bp). As a result, the obtained length distribution is biased toward longer fragments and does not fully represent the actual proportion of short fragments.
DNA inside or outside LNPs – nuclease protection assay
To assess whether residual DNA is located inside the lipid nanoparticles (LNPs) or freely outside them, the enzyme DNase I-XT was added directly to the unmodified vaccine – that is, to intact, non-disrupted LNPs. DNase I-XT degrades accessible DNA. Subsequent qPCR measurement allowed comparison of DNA quantities before and after enzymatic treatment.
Analysis of VAERS data
For each investigated batch, a Serious Adverse Event Reporting Ratio (SRR) was calculated from the VAERS database, defined as the ratio of serious adverse event reports to all reported adverse events. This value was then compared with the measured DNA concentration for the corresponding batch.
c) Key Results
Quantitative findings and method comparison
The comparison of qPCR and Qubit fluorometry results shows that the measured values strongly depend on the analytical method used.
Determination of DNA concentrations for Pfizer
| qPCR | Qubit fluorometry |
| Ori probe: 0,28 – 4,27 ng/dose Spike probe: 0,22 – 2,43 ng/dose | Total DNA: 1.896 – 3.720 ng/dose |
The SV40 promoter-enhancer-Ori was detected only in Pfizer vials, with Cq values between 16,64 and 22,59.
Determination of DNA concentrations for Moderna
| qPCR | Qubit fluorometry |
| Ori probe: 0,01 – 0,34 ng/dose Spike probe: 0,25 – 0,78 ng/dose | Total DNA: 3.270 – 5.100 ng/dose |
Relative to the FDA limit of 10 ng DNA per dose, the qPCR values are below the threshold, whereas the fluorometric values exceed it by 188- to 509-fold.
The authors note that qPCR methods cannot detect DNA fragments below the amplicon length (105–114 bp) and therefore systematically underestimate the total DNA amount.
Furthermore, the measurements revealed variations in DNA levels between different batches of the same vaccine – indicating possible fluctuations in the purification process.
DNA located inside LNPs
After treatment of intact Pfizer vaccine with DNase I-XT, the subsequent qPCR measurement showed little to no change in DNA quantity. Since the enzyme only degrades accessible DNA, this result suggests that the majority of the residual DNA is located inside the lipid nanoparticles (LNPs) and is therefore protected from enzymatic degradation.
Size profile of residual DNA
ONT sequencing of a Pfizer sample revealed a mean fragment length of 214 bp. Individual fragments reached lengths of over 1.000 bp; the longest detected fragment was approximately 3.200 bp and thus corresponded to roughly half of the plasmid length of 7.810 bp.
Since the library preparation systematically excludes fragments below 150 bp, it is assumed that the actual proportion of short fragments in the sample is higher than what is reflected in the sequencing data.
Exploratory VAERS correlation with measured DNA levels
The authors observed a positive correlation between measured DNA concentrations at the batch level and the SRR value of the respective batch. Batches with higher DNA amounts tended to show higher proportions of serious adverse event reports in the VAERS database.
d) Interpretation by the authors
Method dependence of residual DNA assessments
The authors report two fundamentally different measurement outcomes for the same vaccines:
| Method | Result: residual DNA per dose (FDA limit: 10 ng/dose) | Interpretation |
| qPCR | BELOW FDA limit | Compliant |
| Fluorometry | 188- to 509-fold ABOVE FDA limit | Exceedance |
This means that depending on the analytical method used, completely contradictory conclusions can be reached.
This discrepancy is a central finding of the study and highlights the strong methodological dependence of measured DNA quantities.
Note on methodological inconsistency
The authors argue that the observed discrepancies cannot be explained solely by measurement imprecision, but rather result from fundamentally different measurement principles.
The European Medicines Agency (EMA) applies ratiometric guidelines – meaning that there is an allowed limit for the ratio of DNA to RNA (e.g., 330 ng DNA per 1 mg RNA).
However, different methods are used to measure RNA and DNA, which differ in their specificity:
| What is measured | Method used | What is actually measured |
| RNA (main component) | Fluorometry / UV spectrophotometry | Total nucleic acids (non-specific) |
| DNA (residuals) | qPCR | Specific DNA sequences (selective) |
Various supporting sources on this:
- „Rapporteur Rolling Review critical assessment report” (Table S.2.6-16. Evolution of BNT162b2 Drug Substance Methods)
- „EU Official Control Authority Batch Release Certificate for Immunological Products” (Table 2. Drug Substance Quality Control Tests)
- „Assessment report EMA/707383/2020”
- „Assessment report EMA/15689/2021”
The authors argue that if:
- RNA is measured using a non-specific method (fluorometry: also detecting DNA fragments, degradation products, etc.), and
- DNA is measured using a specific method (qPCR: detecting only the exact target sequence),
then the two resulting measurements are not methodologically compatible.
As a result, the calculated DNA/RNA ratios are methodologically biased and not directly comparable.
This argument concerns the comparability of measurement methods, not necessarily the validity of each individual measurement.
The authors advocate that regulatory agencies should not only define threshold values but also specify the exact analytical methods that must be used for compliance testing.
DNA within LNPs: biological implications
The presence of DNA inside lipid nanoparticles (LNPs) is considered by the authors to be potentially biologically relevant. Unlike free, naked DNA – which is rapidly degraded in the body – LNP-encapsulated DNA is protected from nucleases and can be efficiently taken up by cells. According to the authors, existing regulatory thresholds were developed for naked host-cell DNA and do not account for this difference.
Criticism of regulatory guidelines
The authors raise fundamental criticism of current threshold concepts. They argue that existing guidelines are based on outdated assumptions, that they neglect molecule number in favor of mass-based metrics, that they do not consider cumulative dosing (multiple doses within a short period of time), and that they overlook functional sequences such as promoters or nuclear targeting signals. In particular, the presence of the SV40 promoter/enhancer in the Pfizer plasmid is highlighted as a factor that could facilitate the transport of DNA into the cell nucleus.
Exploratory VAERS analysis
The observed correlation is interpreted by the authors as a possible indication of a relationship between DNA content and adverse event profiles. It is explicitly emphasized that this is an exploratory observation and does not allow for causal conclusions. Therefore, the authors call for further investigation.
e) Methodological limitations
The origin, storage, and batch characterization of the investigated samples are overall well documented – cold chain handling, transport conditions, and vial integrity are described. However, the thermal lysis step without subsequent purification is not validated in a regulatory context; information on extraction efficiency is lacking.
All examined vials were already expired at the time of analysis. Three Moderna XBB.1.5 vials consisted of residual volumes remaining after patient administration and were not originally sealed. They therefore differ in sample quality from the other vials and must be assessed separately.
The VAERS correlation is subject to substantial uncertainty. VAERS is a passive reporting system: reports are not systematically verified, reporting rates vary across time periods and regions, and correlations at the batch level do not allow inference of individual causality. The interpretive value of this analysis is therefore structurally limited – independent of the quality of the analytical measurements.
Finally, the ONT sequencing approach only captures fragments above approximately 150 bp due to library preparation, and does not fully represent the true proportion of shorter DNA fragments.
f) Contextualization
The study extends the findings of Kevin McKernan in several ways: it examines additional batches, provides a nuclease protection assay as direct evidence for the intraparticulate location of DNA, and addresses structural limitations of current regulatory methodologies. The analytical component represents a factual contribution to the ongoing debate.
The exploratory component – the linkage with VAERS data – is methodologically demanding and subject to the known limitations of the reporting system. The authors themselves characterize it as hypothesis-generating rather than confirmatory.
The authors point out several limitations of their study and call for replication of their findings under forensic-grade conditions.
Overall, the study emphasizes the need for standardized and methodologically harmonized approaches for assessing residual DNA in mRNA-based medicinal products.
🧬 🧬 🧬
4.3.3. König & Kirchner (2024)
| Methodological Considerations Regarding the Quantification of DNA Impurities in the COVID-19 mRNA Vaccine Comirnaty® Authors: Brigitte König, Jürgen O. Kirchner Published: May 8, 2024 (Peer-reviewed, PubMed) Link to study: https://pubmed.ncbi.nlm.nih.gov/38804335/ |
a) Context and Objective of the Study
The work by Brigitte König and Johannes O. Kirchner differs fundamentally in its objective from the previously described studies. While earlier work primarily aimed at detecting and quantifying residual DNA in mRNA vaccines, this study focuses on a methodological evaluation of the analytical methods used for detection.
The key question is: Is the qPCR-based DNA quantification used in the authorisation process suitable for batch testing and, therefore, as a quality assurance tool?
To address this question, the authors examine:
- which analytical methods are used for the quantification of residual DNA,
- what methodological limitations these methods have, and
- to what extent different methods can lead to divergent results.
The study was peer-reviewed and published in a scientific journal.
b) Materials and Methods
Vaccine batches
The laboratory received several original sealed vials from different batches of the mRNA vaccine Comirnaty® (BNT162b2), provided by official vaccination centers. Storage and transport were carried out under documented compliance with the cold chain (2–8 °C). Four batches were already expired at the time of analysis, while three still had a remaining shelf life of 11 to 13 months.
The authors combine two approaches: a critical methodological analysis of existing procedures and their own laboratory measurements.
A critical analysis of methodology
The authors examine the qPCR method described in the EMA’s November 2020 rolling review document (including the sample preparation protocol set out therein) and identify three structural issues.
First, the qPCR assay detects only a 69 bp target sequence – the T7 promoter – within a 7,824 bp plasmid. The remaining 99% of the plasmid DNA, as well as any potential bacterial genomic DNA, are not captured. The authors note that this limitation is fundamentally inherent to any qPCR approach that targets only single sequences – regardless of which sequence is chosen.
Second, the standard curve used is methodologically problematic. For quantification, a calibration curve is generated using untreated, intact plasmid DNA. However, the DNA in the vaccine sample has undergone multiple processing steps during manufacturing – particularly a DNase digestion – and is therefore fragmented. Since fragmented DNA amplifies less efficiently than intact DNA, the measured concentration is systematically underestimated compared to the true amount present. A correct comparison would require a standard curve generated from DNA that has been subjected to the same treatment steps as the sample.
Third, the question of proportionality arises:
- Are there sequence-dependent differences in degradation rates?
- Is the qPCR target sequence degraded proportionally to the rest of the plasmid during DNase treatment?
- Are certain regions of linearized plasmid DNA degraded more or less efficiently than others?
If proportionality does not hold, any extrapolation from the target sequence to total DNA content is methodologically flawed. The European Pharmacopoeia (Ph. Eur. 2.6.35) confirms this limitation: while qPCR is described as a method of choice for detecting specific sequences, it explicitly notes that other or complementary methods may be required for total DNA quantification.
Considerations on regulatory practice
The authors point to an inconsistency in regulatory practice: according to an European Directorate for the Quality of Medicines & HealthCare protocol, DNA is measured only at the drug substance level, not in the final vaccine product. The rationale given is that lipid nanoparticles (LNPs) may interfere with DNA measurement. At the same time, RNA concentration in the final vaccine is measured using fluorometry after disruption of the LNPs with Triton X-100. Since both RNA and DNA are nucleic acids with comparable analytical properties and both may be encapsulated within LNPs, this difference in approach appears to require further justification. Whether this reflects technical constraints or regulatory considerations not fully disclosed in public documents cannot be conclusively assessed based on the available sources.
Own measurements using Qubit fluorometry
To evaluate the practical suitability of an alternative method, the authors conducted own measurements on seven Comirnaty® batches. Samples were analyzed both before and after the addition of the detergent Triton X-100, which disrupts LNPs and releases their encapsulated contents. Qubit fluorometry with the DNA-specific dye PicoGreen was used as the measurement system.
c) Key Results
Qubit measurements before and after LNP disruption
Without Triton X-100, only small amounts of DNA were detected. After addition of Triton X-100, the measured values increased dramatically – to 360- to 534-fold above the regulatory limit of 10 ng per dose, corresponding to 3,600 to 5,340 ng DNA per dose.
In the four expired batches, between 16% and 81% of the total DNA was already detectable without Triton X-100, suggesting partial degradation of the lipid nanoparticles (LNPs) over storage time. In the three fresh batches, 93% to 97% of the DNA became detectable only after LNP disruption, indicating largely intact particles.
RNA measurements as control
The parallel RNA measurements served as a methodological control and showed plausible values. The authors interpret this as evidence for the general suitability of the Qubit system in this sample matrix.
d) Interpretation by the authors
Critique of qPCR as the sole reference method
The authors conclude that the regulatory qPCR-based method is structurally unsuitable for reliably quantifying total DNA in the final vaccine product. According to their findings, DNA levels substantially exceed the regulatory threshold, but remain undetected because the applied method only measures a small target region of the existing DNA and is additionally performed at the drug substance level rather than on the final product.
Call for methodological adaptation
The authors therefore advocate for fluorometric spectroscopic measurement of total DNA in the final vaccine formulation as part of official batch release testing – analogous to the already established RNA measurement.
DNA within LNPs: biological implications
Furthermore, they call for a reassessment of the potential risks associated with LNP-encapsulated DNA, particularly with respect to possible integration into the human genome.
e) Methodological limitations
Small sample size
The study is based on a limited sample of seven batches. The samples were provided as original sealed vials from official vaccination centers; storage and transport were carried out under documented cold chain conditions. The provenance documentation is therefore comparatively well substantiated.
Influence of expiry date on LNP integrity
Four of the seven batches were already expired at the time of analysis. Expired samples may undergo chemical changes, particularly with regard to lipid nanoparticle (LNP) integrity. The authors explicitly acknowledge this and interpret the increased detectability of DNA without Triton X-100 in expired batches as an indication of partial LNP degradation over time.
No RNase treatment prior to fluorometry (Qubit)
Qubit assays use DNA-specific dyes that can also exhibit interference with RNA (the main component of the vaccine). Without prior RNase digestion, the measured „DNA amount” is likely to be overestimated.
Lack of formal validation
The Qubit method was not formally validated by the authors according to regulatory standards. Such validation – required under the ICH Q2(R2) for regulatory analytical methods – includes systematic demonstration of specificity, limit of detection, linearity, precision, accuracy, robustness, and matrix effects. The authors justify the suitability of the method through an argumentative approach: by comparing measurements before and after LNP disruption and by demonstrating plausible RNA control values. This is an acceptable framework for a scientific publication aimed at illustrating a methodological point. This remark is not intended as a criticism of the authors’ diligence, but rather as an objective assessment of the context in which the work was published.
Lack of validation of extraction efficiency
Extraction methods do not always demonstrate that they completely release and quantify all DNA (particularly small fragments and encapsulated DNA). This can lead to over- or underestimates.
Availability of regulatory test methods
The methodological critique relies, with respect to the regulatory qPCR method, on a rolling review document from the early authorization phase. Whether the method described there is identical to the final approved batch release assay cannot be conclusively determined based on publicly available sources.
f) Contextualization
König and Kirchner make a methodologically independent contribution to the debate. Unlike the work of Kevin McKernan and David J. Speicher, the focus is not on how much DNA is present, but on whether the analytical methods used are capable of reliably answering that question in the first place.
The study thus makes an important contribution to the debate by:
- highlighting the methodological dependence of measurement outcomes
- exposing limitations of established standard methods (in particular qPCR)
- and emphasizing the need for cross-method validation
It also illustrates that differences between studies do not necessarily reflect contradictory or incorrect results, but are often explained by:
- different detection methods
- different target sequences
- and variations in sample preparation
Overall, the work underscores that DNA quantification in this context is methodologically complex and that results from different studies are only limitedly comparable in a direct way.
🧬 🧬 🧬
4.3.4. Didier Raoult (2024)
| Confirmation of the presence of vaccine DNA in the Pfizer anti-COVID-19 vaccine Authors: Didier Raoult Published: November 12, 2024 (Preprint, HAL Open Science) Link to study: https://hal.science/hal-04778576v1 |
a) Context and Objective of the Study
The work by Didier Raoult is part of a series of independent investigations examining the presence of DNA in mRNA-based COVID-19 vaccines.
The objective of the study is to experimentally confirm the presence of DNA components in the Pfizer/BioNTech vaccine and to independently verify the findings reported by earlier research groups. The study is therefore primarily intended as a replication effort.
b) Materials and Methods
Vaccine batches
The study examined only the Comirnaty® (BNT162b2) mRNA vaccine manufactured by BioNTech/Pfizer. The analysis was based on a limited number of samples; the available report does not provide a systematic overview of vaccine batches.
The study employed classical molecular biology techniques for nucleic acid analysis.
Disruption of lipid nanoparticles (LNPs)
The lipid nanoparticles (LNPs) were disrupted using the detergent Triton X-100.
Quantification by Qubit fluorometry
For one batch (No. GJ7184), DNA quantification was performed using a commercial Qubit fluorometer, both before and after LNP disruption with Triton X-100.
Illumina sequencing
Two batches (FP8191 and FP9359) were analyzed using Illumina sequencing. Reverse transcription was deliberately omitted, meaning that RNA was not converted into DNA. This ensured that only DNA originally present in the sample was sequenced, rather than DNA copies generated from vaccine mRNA.
The resulting reads (sequenced fragments) were compared with the known plasmid DNA reference sequence, GenBank OR134577.1. For the bioinformatic analysis, only sequence fragments longer than 200 bp and showing more than 90% identity to the reference sequence were included.
As a control experiment, the samples were treated with DNase prior to sequencing and then sequenced again to determine whether the observed signal was indeed attributable to DNA.
c) Key Results
Quantification by Qubit fluorometry
Ohne Triton X-100 wurden durchschnittlich 216 ng DNA pro Dosis gemessen. Nach LNP-Aufschluss mit Triton X-100 stieg der Wert auf durchschnittlich 5.160 ng pro Dosis – ein Anstieg um das ca. 24-Fache. Bezogen auf den angegebenen RNA-Gehalt von 30 µg pro Dosis entspricht dies rechnerisch einem DNA-Anteil von etwa 17 %.
Without Triton X-100 treatment, an average of 216 ng of DNA per dose was measured. After disruption of the lipid nanoparticles (LNPs) with Triton X-100, the value increased to an average of 5,160 ng per dose, representing approximately a 24-fold increase. Based on the stated RNA content of 30 µg per dose, this corresponds mathematically to a DNA proportion of approximately 17%.
Sequencing by Illumina
Using Illumina sequencing, more than 140,000 reads longer than 200 base pairs were generated. From these data, the complete 7.824 bp plasmid sequence could be reconstructed. This indicates that the DNA fragments present collectively covered the entire plasmid sequence.
Die Sequenzierungstiefe war mit mehr als 4.000-facher Abdeckung außergewöhnlich hoch – das bedeutet, jede Position des Plasmids wurde im Durchschnitt von mehr als 4.000 unabhängigen Reads abgedeckt. Die Sequenzdaten beider Chargen wurden in der GenBank hinterlegt (PP544445 und PP544446).
The sequencing depth was exceptionally high, with more than 4.000-fold coverage, meaning that each position within the plasmid was covered on average by more than 4.000 independent reads. The sequence data from the two analyzed batches were deposited in GenBank under accession numbers PP544445 and PP544446.
Between 63% and 97% of the sequenced DNA could be assigned to the vaccine plasmid. The origin of the remaining 3% to 37% was not further investigated.
DNase control experiment
Following DNase treatment, virtually no reads were detected (only 1–2 reads remained). This near-complete loss of signal after DNase treatment suggests that the sequencing signal indeed originated from accessible DNA, either freely present or released after LNP disruption.
d) Interpretation by the authors
Reproducibility
The author interprets the findings as an experimental confirmation of results reported in earlier studies. The abundant presence of plasmid DNA in the Pfizer/BioNTech vaccine could be demonstrated across multiple batches and using several independent analytical approaches. The consistency with previous reports is presented as evidence supporting the reproducibility of such findings.
DNA encapsulated in cationic lipids: biological implications
With regard to potential biological consequences, the author notes that plasmid DNA encapsulated within lipid nanoparticles (LNPs) could, in theory, integrate into the genome after cellular uptake. However, the author explicitly characterizes the actual risk as extremely low. Nevertheless, he argues that further investigation of this question would be scientifically justified.
e) Methodological limitations
Origin and storage of the samples
Information regarding the origin, storage history, and condition of the analyzed vials is largely absent. It is not documented whether the samples were originally sealed, properly refrigerated, and unopened prior to analysis.
Missing methodological details
Several important methodological details are not specified:
- No information is provided regarding RNase treatment to remove RNA before DNA quantification.
- The specific Qubit kit used (High Sensitivity or Broad Range) is not reported.
- No information is given on the extraction efficiency for LNP-encapsulated DNA.
- The DNase treatment is described only as using a „TURBO DNA-free kit”; the specific enzyme type is not identified.
Small sample size
The study is based on a limited sample of three vaccine batches.
Sequencing and quantification
Illumina sequencing provides strong evidence for the presence and completeness of the plasmid sequence, but it is not an appropriate method for absolute quantification. High sequencing depth can arise even when relatively few DNA molecules are present at high copy number; therefore, sequencing coverage does not necessarily reflect the actual mass or concentration of DNA in the sample.
f) Contextualization
The study supplements the existing body of evidence by providing further independent proof of plasmid DNA in mRNA vaccines. Its main contribution lies in the reproducibility of the qualitative findings: another laboratory, using different methods and different batches, has arrived at comparable results.
🧬 🧬 🧬
4.3.5. Kämmerer et al. (2024)
| BioNTech RNA-Based COVID-19 Injections Contain Large Amounts Of Residual DNA Including An SV40 Promoter/Enhancer Sequence Authors: Ulrike Kämmerer, Verena Schulz, Klaus Steger Published: December 3, 2024 (Peer Reviewed, Cureus/Public Health Policy Journal) Link to study: https://publichealthpolicyjournal.com/biontech-rna-based-covid-19-injections-contain-large-amounts-of-residual-dna-including-an-sv40-promoter-enhancer-sequence/ |
a) Context and Objective of the Study
The study investigates the presence of DNA components in mRNA-based COVID-19 vaccines, with a particular focus on regulatory sequence elements. Against the background of previous analyses, the study addresses three central questions:
- Can the high amount of residual DNA in BioNTech batches be confirmed using different analytical methods?
- Can existing DNA fragments be co-delivered into human cells together with the mRNA (transfection)?
- Does this lead to sustained spike protein production?
b) Materials and Methods
Vaccine batches
For the analyses, four original, unopened BNT162b2 batches were used:
- FD7958, FE6975, and EX8679 (monovalent, Wuhan strain; expiration date October/August 2021)
- HD9869 (bivalent, Wuhan/Omicron XBB1.5; expiration date October 2024)
Batch GH9715, for which DNA contamination had already been demonstrated in previous studies, served as a positive control.
All vials were obtained from a pharmacy under refrigerated conditions, were originally sealed, and were continuously kept cold during transport and storage. The provenance documentation is therefore comparatively well substantiated.
Quantification
The lipid nanoparticles (LNPs) were disrupted using Triton X-100.
RNA quantification was performed using the Qubit RNA High Sensitivity assay.
For DNA quantification, three different fluorometric dsDNA assays were used:
- Qubit dsDNA High Sensitivity assay
- Quanti-iT PicoGreen dsDNA assay
- AccuBlue High Sensitivity dsDNA assay
Fluorescence-based measurements were performed using a plate reader both before and after RNase A treatment (an RNA-degrading enzyme).
The use of three independent assays is methodologically considered an orthogonal approach: agreement across all three increases the reliability of the results substantially.
Cell line experiments and ELISA
To investigate whether the vaccines transfect human cells and lead to spike protein production, HEK293 cells were used – an immortalized human cell line with high transfection efficiency.
The cells were cultured under standardized conditions. They were obtained from certified original stocks and were regularly tested negative for mycoplasma contamination.
For the transfection experiments, the cells were seeded in 12-well plates. The cell density was selected such that, after a short growth period, approximately 80% of the bottom surface area was covered. Each well was transfected with 1/12 of a clinical dose (corresponding to 25 µl) of the respective vaccine. An immediate medium change or washing step after transfection is not documented.
Cells and culture medium were harvested at day 1, day 3, day 5, and day 7 post-transfection. Untransfected cells at day 7 served as a negative control.
For protein analysis, the cells were washed to remove residual culture medium. Cells were then lysed using a lysis buffer, releasing intracellular contents. The amount of SARS-CoV-2 spike protein in both the cell lysate supernatant and the culture medium was quantified using a highly sensitive commercial ELISA kit.
Immunohistochemistry
Immunohistochemistry was performed to visualise the spike protein within the cells. To this end, HEK293 cells were seeded in 24-well plates (60% cell density) and transfected with 12.5 µl of a clinical dose per well (200 µl medium). After a 4-hour incubation, the cells were washed twice with PBS and supplemented with 500 µl of fresh medium.
Twenty-four hours after the start of transfection, cells were harvested, fixed, embedded in 2% agarose, and processed into paraffin blocks after dehydration. Thin sections were cut from these blocks.
The cell sections were treated with a specific primary antibody against the SARS-CoV-2 spike protein (S1 subunit), which binds only to the spike protein. A secondary antibody, which binds to the first and triggers a colour reaction, was added. The spike protein appeared green under the microscope, whilst the cell nucleus was counterstained blue with haematoxylin for better visualisation.
PCR and agarose gel electrophoresis
Conventional PCR was used to test whether vaccine-derived DNA enters human cells. For each target region of the plasmid, a separate primer pair was used – for spike sequences, the ORI replication origin, the neomycin resistance cassette, and the SV40 promoter/enhancer. Each PCR reaction contains exactly one primer pair, thereby generating a defined amplicon.
The PCR products were separated by agarose gel electrophoresis and their sizes determined by comparison with a DNA marker (GeneRuler). HEK293 cells were treated with half a vaccine dose (150 µl); after six hours, DNA was isolated and analyzed. Untreated cells served as a negative control.
Extracellular vesicles and mass spectrometry
Background: Cells constantly release extracellular vesicles (small membrane-bound particles) which, like tiny parcels, contain signalling molecules. These vesicles can travel to other cells.
To investigate whether transfected cells release vaccine components via extracellular vesicles (EVs), EVs were isolated from the cell culture medium and analyzed using mass spectrometry (TimsTOF-HT). Protein identification was performed by comparison with a database containing human proteins as well as vaccine vector and spike sequences.
c) Key Results
Transfection and spike protein production
All four investigated batches led, under the applied cell culture conditions, to efficient uptake of mRNA into HEK293 cells and detectable spike protein production.
The proportion of spike-positive cells ranged from 74.6% to 90.5%; untransfected cells showed no signal. Transfected cells additionally exhibited morphological changes – such as intracellular vacuolization and detachment from the growth surface – interpreted as signs of a cytopathic effect.
Spike protein production was detectable as early as day 1, increased until day 5, and remained detectable up to day 7. The authors interpret this as an indication of prolonged expression beyond the expected timeframe.
Spike protein release into cell culture medium
Spike protein was detectable in the cell culture medium for the monovalent batches; the bivalent batch was below the detection limit.
Spike-Protein-Freisetzung über extrazelluläre Vesikel
Mass spectrometry showed that spike protein was primarily detectable in extracellular vesicles (14 spectral counts), while only minimal amounts were present in the soluble medium (2 spectral counts). The highest intracellular concentration was observed in the cell lysate (60 spectral counts).
RNA content
The measured RNA values corresponded to the manufacturer’s specification of 30 µg per clinical dose.
DNA content
Without LNP disruption, DNA values were 1.6- to 6.7-fold lower than after Triton X-100 treatment –further evidence that DNA is predominantly located inside the lipid nanoparticles.
Without RNase treatment, measured DNA values ranged from 1.326 to 4.225 ng per dose. After RNase A treatment, values decreased to 32,71 to 43,38 ng per dose. The authors attribute the elevated initial readings to background signal caused by structured RNA regions: dsDNA-specific dyes preferentially bind double-stranded DNA but can generate increased signals in the presence of large amounts of RNA.
After correction, the measured DNA amounts exceeded the levels specified in regulatory guidelines. The results were reproducible across multiple measurements and showed good agreement between the three assays used.
PCR detection of plasmid elements
Strong PCR signals were detected in all four batches for all tested plasmid elements – spike sequences, ORI, neomycin resistance cassette, and the SV40 promoter/enhancer. The same elements were also detectable in HEK293 cells after transfection. For the SV40 promoter/enhancer, the primers produced two amplicons of different sizes (93 bp and 165 bp), a known methodological outcome attributable to the structure of the target sequence.
d) Interpretation by the authors
The authors conclude that the investigated batches contain residual DNA that exceeds regulatory threshold values. The DNA is predominantly LNP-encapsulated, is taken up by cells, and remains detectable within them. The sustained spike protein production beyond seven days raises questions about the mechanism underlying this prolonged expression.
The authors place particular emphasis on the presence of the SV40 promoter/enhancer. This element is not required for mRNA production in E. coli. They discuss that such regulatory elements can influence transcriptional activity in certain experimental contexts. A potential role in nuclear localization or genomic integration is raised as a theoretical consideration.
The authors criticize existing regulatory limits as not being designed for LNP-based RNA injection products and emphasize that there is currently no scientific evidence sufficient to define a universally safe DNA threshold for this product class.
They also report that spike protein is released via extracellular vesicles (exosomes). The extent to which such vesicles contribute to protein distribution in the human body remains an active area of research and is not yet fully understood.
Finally, the authors highlight a fundamental issue: the choice of analytical method significantly influences the results, and this must be carefully considered when comparing studies.
e) Methodological limitations
Cell line
HEK293 cells are immortalized and exhibit altered properties compared to primary cells (e.g., muscle, immune, or neuronal cells), particularly higher transfection efficiency and modified regulatory mechanisms.
Dosage
The applied dose is not physiologically representative. The quantities used (e.g., 1/12 of a clinical dose per well) result in direct and locally high cellular exposure that does not reflect distribution conditions in the human body.
In vitro context
All experiments were conducted under cell culture conditions. Direct extrapolation to in vivo conditions – such as distribution, degradation, or immune response in the human body – is therefore not straightforward.
Assay specificity
Fluorometric methods are sensitive to interference signals, which may affect DNA quantification.
Mean value interpretation
The measured residual DNA ranged from 32,71 to 43,38 ng per clinical dose. These values are based on fluorometric measurements using three different assays (PicoGreen, Qubit, AccuBlue). Since the individual assays produced partly divergent results, the reported range represents the arithmetic mean across methodologically different measurement principles. The spread of individual measurements is substantial, meaning the mean value should primarily be interpreted as an orienting estimate.
f) Contextualization
The study goes beyond the mere quantification of residual DNA: it links analytical detection with cell-based experiments and examines potential biological consequences. It combines multiple analytical and functional methods (fluorometric assays, PCR, ELISA, and mass spectrometry), thereby pursuing a comparatively broad investigative approach.
The study further highlights that even within the same methodological category, substantial differences can occur between individual fluorometric assays. This finding underscores the importance of methodological standardization for future investigations.
🧬 🧬 🧬
4.3.6. Wang et al. (2024)
| A rapid detection method of replication-competent plasmid DNA from COVID-19 mRNA vaccines for quality control. Authors: Tayler J. Wang, Alex Kim, Kevin Kim Published: December 29, 2024 (Journal of High School Science, peer-reviewed) Link to study: https://jhss.scholasticahq.com/article/127890-a-rapid-detection-method-of-replication-competent-plasmid-dna-from-covid-19-mrna-vaccines-for-quality-control |
a) Context and Objective of the Study
The study by Wang et al. addresses a different research question than the studies presented so far. The focus is not on the total amount of residual DNA but on a more specific question: Does the detected DNA contain functional, replicable plasmid sequences – that is, fragments that could be introduced into bacteria and replicated there??
To answer this question, the authors developed a simple and rapid detection method. Their underlying rationale was that if the DNA template used during vaccine manufacturing had not been completely removed, intact or nearly intact plasmids might still remain in the final product.
The work was conducted as part of an FDA student volunteer program and carried out on the FDA White Oak Campus with support from scientists at the U.S. Food and Drug Administration (FDA). The publication venue, the Journal of High School Science, reflects the educational context of the project rather than the institutional setting in which the work was performed.
b) Materials and Methods
Vaccine batches
The study uses several fundamentally different sample sources, which must be clearly distinguished when interpreting the results.
First, the authors investigated a self-produced laboratory vaccine containing the XBB.1.5 spike sequence, manufactured using a commercial lipid nanoparticle (LNP) kit. Second, they examined biosimilar reference materials obtained from BEI Resources. These NIH-supported reference materials were produced for research purposes and are not identical to licensed commercial vaccine batches. Third, they analyzed two commercial Pfizer vaccine batches – Lot PAA194854 (monovalent) and Lot PAA184098 (bivalent) – which were original sealed, licensed vaccine products.
| Vaccine / Material | Source | Description |
| In-house mRNA vaccine | Self-produced | Contains XBB.1.5 spike sequence, formulated in LNPs |
| Moderna Biosimilar | BEI Resources | Not the original commercial product |
| Pfizer Biosimilar | BEI Resources | Not the original commercial product |
| COMIRNATY Original (NR-59604) | BEI Resources | Monovalent (Wuhan strain) |
| COMIRNATY Bivalent (NR-59605) | BEI Resources | Bivalent (Wuhan + Omicron BA.5) |
DNA-Extraktion DNA extraction
DNA was extracted using a commercial plasmid miniprep kit (Monarch Plasmid DNA Miniprep, New England Biolabs). The kit contains RNase A in the neutralization buffer, resulting in substantial degradation of RNA during the extraction process. DNA was eluted in 30 µl of nuclease-free water.
Quantification
DNA concentration was determined using two methods: NanoDrop spectrophotometry and the Qubit dsDNA High Sensitivity (HS) assay. The authors explicitly note that NanoDrop does not distinguish between DNA and RNA and may be influenced by free nucleotides, salts, and organic compounds. Qubit is more specific for double-stranded DNA, but can also overestimate DNA concentrations in the presence of large amounts of RNA or when samples are inadequately prepared.
Transformation assay – the proposed detection method
The first step involves extraction of DNA from the vaccine sample. The extracted material consists of various DNA fragments, potentially including the origin of replication (ORI), which serves as the starting point for plasmid replication, and an antibiotic resistance gene, which enables selection of transformed bacteria.
The extracted DNA is then treated with T4 DNA ligase. This enzyme joins DNA fragment ends together. As a result, linear DNA fragments can be re-circularized into plasmids. Because the ligase can join compatible DNA ends regardless of their original arrangement, fragments that were separate in the original vaccine preparation may become artificially linked, creating recombinant artifacts.
These newly formed plasmids are subsequently introduced into specially prepared E. coli bacteria through a transformation procedure.
The underlying reasoning:
- If DNase digestion during vaccine manufacturing was efficient, the remaining DNA fragments should be so small that they no longer contain a complete origin of replication (ORI) or a complete antibiotic resistance gene. In that case, even after ligation, no functional plasmid can be formed.
- If DNase digestion was incomplete, larger DNA fragments may still be present that contain intact ORI and antibiotic resistance sequences. After ligation, these fragments may be able to form a functional plasmid. Importantly, the ligase can only join DNA ends that already exist; it cannot reconstruct missing portions of a gene from numerous small fragments.
Only bacteria that acquire a plasmid containing both a functional antibiotic resistance gene and a functional ORI can survive on antibiotic-containing growth media and form visible colonies. The appearance of bacterial colonies therefore serves as a direct biological indication that replication-competent plasmid DNA was present in the original vaccine sample.
Size analysis
Fragment sizes were determined using agarose gel electrophoresis and an Agilent 2100 Bioanalyzer.
c) Key Results
Quantitative findings
DNA amounts per dose measured by Qubit ranged from 40 to 110 ng, thus above the WHO guideline threshold of 10 ng. NanoDrop yielded substantially higher values (several thousand ng), which the authors attribute to the well-known lack of specificity of this method.
Laboratory vaccine and biosimilar materials
In the self-produced laboratory vaccine and the Pfizer biosimilar, replication-competent DNA fragments were detected: the transformation assay produced bacterial colonies. In contrast, no colonies were observed in the Moderna biosimilar and the in-house standard, despite higher measured DNA concentrations. This indicates that colony formation is not determined solely by total DNA quantity, but depends on the integrity of functional sequence elements.
Commercial Pfizer batches
In the two commercial Pfizer batches, no replication-competent DNA fragments were detected; the transformation assay did not yield colonies. Fragment size analysis showed that nearly all detected DNA was shorter than 35 bp. According to the authors, this is consistent with a fully effective DNase digestion during manufacturing.
d) Interpretation by the authors
The authors interpret the absence of replication-competent DNA in the commercial batches as evidence of the effectiveness of the industrial manufacturing process. The complete fragmentation of plasmid DNA to below 35 bp makes any biological activity of the residual DNA unlikely, according to the authors – including the SV40 promoter/enhancer sequence, whose functionality is considered practically impossible at such fragment sizes.
At the same time, the authors confirm that total DNA levels exceed the WHO guideline threshold and recommend stricter and more transparent monitoring of residual DNA. They frame this recommendation as a measure also intended to strengthen public confidence in mRNA vaccine technologies.
e) Methodological limitations
Sample size and selection
The study includes only two commercial batches, which does not allow for robust conclusions regarding batch-to-batch variability. The biosimilar materials used are not identical to licensed commercial products; therefore, findings from these samples cannot be directly generalized to marketed vaccine products.
DNA extraction
Extraction was performed using a plasmid miniprep kit that is primarily optimized for the isolation of intact plasmids. It is not yet fully understood to what extent highly fragmented DNA fragments – particularly very short fragments – are fully captured using this method.
Detection limits of the transformation assay
The method only detects DNA fragments that, after ligation, contain a functional origin of replication (ORI) and an antibiotic resistance gene. It assesses whether sufficiently large fragments (>800 bp for the resistance gene, >600 bp for the ORI) are present that could form a functional plasmid after ligation. Fragments lacking these elements – even if they contain other relevant sequences such as the SV40 enhancer (approximately 72–165 bp) – are not detected.
In addition, ligation can artificially generate plasmids that were not present in the original vaccine sample.
Limits of functional interpretability
The transformation assay exclusively evaluates whether DNA fragments can form a replication-competent plasmid after uptake into bacteria. Other potential biological properties of DNA fragments are not assessed. In particular, the method does not allow conclusions about whether smaller or non-replicating fragments may have functional effects in other biological contexts. The study therefore specifically assesses bacterial replicative capability of certain plasmid components, not the broader biological relevance of all detectable DNA fragments.
f) Contextualization
The study by Wang et al. investigates whether biologically active, replication-competent plasmid DNA can still be detected in vaccine samples.
It thereby adds an additional layer to the ongoing discussion. While PCR, fluorometry, and sequencing methods primarily provide information on quantity, sequence identity, and fragment length, the transformation assay used here specifically assesses the functional integrity of DNA in a bacterial system.
At the same time, the scope of the method is limited to the experimentally tested function: the assay only detects DNA that is transformable and replicable in bacteria. Other biological properties or potential mechanisms of action of DNA fragments are not examined.
Overall, the study provides a methodologically interesting contribution by focusing on the functional relevance of residual DNA, thereby complementing purely quantitative analyses.
The work thus highlights that the assessment of residual DNA should not rely solely on quantity but also consider its structural and functional properties.
🧬 🧬 🧬
4.3.7. Fleming et al. (2025)
| Quantitative Analysis of Nucleic Acid Content in Spikevax (Moderna) and BNT162b2 (Pfizer) COVID-19 Vaccine Lots Authors: Richard M Fleming PhD, MD, JD; Peter Kotlár MD; Sona Pekova MD, PhD Published: May 13, 2025 (Herald Open Access) Link to study: https://www.heraldopenaccess.us/openaccess/quantitative-analysis-of-nucleic-acid-content-in-spikevax-moderna-and-bnt162b2-pfizer-covid-19-vaccine-lots |
a) Context and Objective of the Study
The study was conducted in the context of an official request from authorities in Slovakia. The aim of the investigation was to characterize the nucleic acid composition of mRNA COVID-19 vaccines with regard to:
- identification and quantification of contained nucleic acids
- assessment of batch homogeneity (between and within lots)
- detection of undeclared genetic material
- evaluation of the stability of expired batches
The results were intended to provide insights into vaccine composition, stability, and manufacturing practices.
b) Materials and Methods
Vaccine batches
Molecular analyses were performed on 24 batches – 17 Moderna and 7 Pfizer:
Spikevax (Moderna): MV1013A, 200023A, 200156A, 223049, 200090A, 200106A, 200100A, 3005885, 3005836, 000090A, 000058A, 3005241, 3005697, 3006272, MV1018A, 400012A, 400011A and
BNT162b2 (Pfizer): FP9632, 1F1051A, 1LO84A, 1F1047A, 1F1059A, 1F1055A, PCB0020.
For each batch, five original, unopened vials were analyzed. Samples were stored at −80 °C and transported under documented temperature-controlled conditions. The provenance documentation is therefore comparatively well substantiated.
Disruption of lipid nanoparticles (LNPs)
Lipid nanoparticles were disrupted using a combination of:
▫️chaotropic salts (QIAamp DNA Mini Kit, Qiagen)
▫️heat treatment (60 °C)
▫️enzymatic digestion (proteinase K)
This released both the mRNA and any residual DNA.
Reverse transcription and multiplex qPCR
The mRNA was converted into cDNA by reverse transcription. Quantification was then performed using multiplex real-time PCR (Rotor-Gene Q, Qiagen) with four simultaneous fluorescence channels:
- FAM (green): for S-protein (cDNA)
- HEX (yellow): for vector origin (Ori) DNA
- Cy5 (red): for E. coli DNA
- ROX: as a passive reference signal
All three target sequences were thus measured simultaneously in a single reaction, although potential interactions between targets (e.g., competition for reagents) may influence quantification.
Quantification by qPCR
For the multiplex quantitative real-time PCR, the authors used primers targeting three different sequences:
| Target | Source |
| mRNA for S-protein (Spikevax & BNT162b2) | self-designed |
| Expression vector DNA (Ori) | adopted from previous studies |
| E. coli genomic DNA (ITS) | from a commercial kit (ISO 13485-validated) |
All primers and fluorescence-labeled hybridization probes were custom-synthesized by Eurofins Genomics (Germany).
Calibration strategy
Since the mRNA in the vaccines contains N1-methylpseudouridine modifications and the exact extent of these modifications is not known, it was not possible to generate synthetic standards for a conventional target-specific calibration curve. Instead, the authors validated PCR efficiency using serial dilution series of the vaccine samples themselves. For absolute quantification, they applied a universal calibration curve derived from averaged dilution series of 50 different microorganisms.
Verification by Sanger sequencing
All PCR products from the 24 batches were verified by Sanger sequencing and compared against database reference entries.
c) Key Results
mRNA detection and batch variability
PCR analysis confirmed the presence of the declared spike protein mRNA sequences in both vaccines.
Analysis of S-protein mRNA showed substantial variability between different batches for both products.
Absolute mRNA levels ranged from 10⁹ to 10¹⁰ copies/ml (measured as cDNA). However, some batches exhibited approximately 10-fold lower mRNA levels in both vaccine types.
Detection of undeclared DNA sequences as an incidental finding
During validation of the cDNA dilution series, unexpectedly strong signals appeared in the DNA channels: the Cy5 channel (targeting Ori DNA) and, in some cases, the HEX channel (targeting E. coli DNA). Since the samples contained both cDNA and residual DNA, the Ori and E. coli primers also amplified these unintended templates. The resulting PCR products were purified and identified by Sanger sequencing, showing 100% sequence identity with the expression vector (plasmid Ori and spike cassette) as well as the E. coli ITS region.
Quantitative DNA findings
A central finding of the study is the consistently high DNA content across all tested batches of both Moderna and Pfizer vaccines.
| Vaccine | mRNA (cDNA) (copies/ml) | DNA amount (copies/ml) |
| Spikevax (Moderna) | 109 – 1010 | 107 – 109 |
| BNT162b2 (Pfizer) | 1010 – 1011 | 108 – 109 |
Indication of near-complete DNA constructs
The authors note that the Ori primer (5′-end of the construct) and the Spike primer (3′-end, bases 3184–3417) both yield a signal simultaneously. Since the two primer binding sites are several thousand base pairs apart, this suggests that at least longer DNA fragments are present that could encompass both target regions.
Batch heterogeneity in Moderna products
In three Moderna batches, the ratio of spike DNA to vector DNA is inverted and shifted by an order of magnitude in a manner that does not align with a single plasmid construct. The authors speculate that these batches may contain a second DNA construct – potentially an Omicron variant inserted into the same vector backbone.
E. coli DNA
In two Pfizer batches, E. coli genomic DNA was detected at levels of approximately a few copies per milliliter, just above the assay’s detection limit.
SV40
No evidence of SV40 sequences was detected.
d) Interpretation by the authors
Presence of DNA
The authors argue that the detected DNA quantities – comparable in magnitude to the declared mRNA levels (on the order of 10⁷ to 10⁹ copies/ml) – are too high to be explained as random contamination. They therefore interpret the DNA as a regular, albeit undeclared, component of the vaccine formulations.
Batch variability and mRNA identity
Batch-to-batch variability in mRNA content is assessed as a potential issue for dosing consistency. The use of the outdated Wuhan spike sequence is described as a limitation with respect to protective efficacy against currently circulating variants.
Based on their findings, the authors recommend:
- improved purification protocols
- stricter batch testing
- genomic updates of vaccine constructs
- enhanced regulatory oversight
e) Methodological limitations
Universal calibration curve
Absolute quantification was not based on a target-specific standard curve, but on a universal curve derived from the average of 50 different microorganisms. This approach assumes comparable PCR efficiency across all target sequences. However, this assumption is not necessarily valid, particularly when dealing with different target types (mRNA, plasmid DNA, bacterial DNA) and complex sample matrices. As a result, absolute copy numbers should be interpreted with caution, whereas qualitative findings – i.e., the presence of detected sequences – are less affected.
No measurement prior to LNP disruption
In contrast to other studies, no measurements were performed before lipid nanoparticle (LNP) disruption. Therefore, a direct comparison that could have provided information on the fraction of LNP-encapsulated DNA is missing.
Non-informative SV40 conclusion
The authors report no detection of SV40. However, the primer set used did not include SV40-specific sequences. Consequently, while the statement is technically correct, it is not informative: neither detection nor exclusion of SV40 could be meaningfully assessed with the employed methodology.
f) Contextualization
The study by Fleming et al. expands the existing literature primarily through its comparative approach across a relatively large number of batches.
Methodologically, it combines multiplex qPCR with Sanger sequencing to verify the amplified products. The detection of DNA sequences, including plasmid and bacterial DNA, is consistent with previous studies.
The work places particular emphasis on differences between batches as well as quantitative comparisons of measured nucleic acid fractions. The observed variability between individual lots thus adds to the ongoing discussion regarding potential differences in composition, fragmentation, and analytical detectability of residual DNA.
🧬 🧬 🧬
4.3.8. Speicher et al. (2025)
| Quantification of residual plasmid DNA and SV40 promoter-enhancer sequences in Pfizer/BioNTech and Moderna modRNA COVID-19 vaccines from Ontario, Canada Authors: David Speicher, Jessica Rose, Kevin McKernan Published: September 25, 2025 (PubMed/Herald Open Access) Link to study: https://pubmed.ncbi.nlm.nih.gov/40913499/ |
a) Context and Objective of the Study
The study by Speicher, Rose, and McKernan is a methodologically extended follow-up to an earlier investigation by the same research group (Study 2, 2023). It builds on findings from McKernan et al. and Kämmerer et al., and aims to quantify residual DNA in mRNA vaccines using two independent methods – qPCR and Qubit fluorometry with RNase correction – across a larger sample set.
In addition, fragment lengths are assessed using Oxford Nanopore sequencing, and an exploratory correlation with VAERS adverse event data is performed.
b) Materials and Methods
Vaccine batches
A total of 32 vials from 16 batches of mRNA-based COVID-19 vaccines were analyzed: BNT162b2 (Pfizer/BioNTech; 10 vials from 6 batches) and mRNA-1273 (Moderna; 22 vials from 10 batches). The samples were obtained from various pharmacies in Ontario, Canada.
All vials were original sealed and featured intact flip-off caps with batch numbers and expiry dates. Storage and transport were carried out under cold-chain conditions (2–8 °C). The samples were stored in specialized cooling units and transported in insulated containers with ice packs, and were placed in the laboratory refrigerator within 5 hours of receipt.
A subset of samples consisted of residual volumes from recently used vials (within 30 minutes of clinical use), which were also transported under refrigeration and stored in the laboratory within 12 hours.
One Moderna sample had no printed expiration date but included a QR code enabling identification by pharmacy personnel.
Disruption of lipid nanoparticles (LNPs)
To disrupt lipid nanoparticles (LNPs), samples were heated for 8 minutes at 95 °C and subsequently cooled to 4 °C for 5 minutes. This thermal step serves to release the contained nucleic acids.
DNA quantification by qPCR
DNA concentrations were determined using qPCR based on Cq values. The primers largely correspond to previous assays developed by the research group: spike probe, ORI probe, and an SV40 enhancer assay for Pfizer batches.
Quantification was performed using a calibration curve based on synthetic DNA and 10-fold dilution series (QuantStudio 3). From the measured copy numbers of the target sequences, total DNA per dose was extrapolated, taking into account the full plasmid length (Pfizer: 7,824 bp; Moderna: 6,777 bp).
For each measurement, 1 µL of treated vaccine sample was directly added to the qPCR reaction without prior DNA extraction. Potential PCR inhibition by vaccine components was assessed using dilution series of selected samples.
DNA quantification using Qubit fluorometry
Samples were measured multiple times using the DNA-specific dye AccuGreen: without pretreatment, after LNP disruption by heating, and after RNase A treatment. The latter corrects for RNA-derived signal contributions (fluorescence dye crosstalk, as the dye can also bind RNA). The authors tracked fluorescence decay over a 10-minute time course, allowing them to estimate the RNA-related signal fraction and calculate the corrected DNA concentration.
Size profiling of residual DNA via ONT sequencing
To determine DNA fragment size distribution, a previously sequenced Pfizer batch (FL8095) was used as a reference standard. Sequencing was performed using an Oxford Nanopore Flongle system with the Ligation Sequencing Kit (SQK-LSK114). The resulting reads were aligned to a reference plasmid sequence.
The library preparation method (SPRI-based cleanup) may result in loss of short fragments (<100–200 bp), which can bias the observed length distribution toward longer DNA fragments.
Assessment of nuclease susceptibility
To assess whether DNA is located inside lipid nanoparticles (LNPs), DNase I-XT was added directly to the untreated vaccine samples. After a 30-minute incubation, the enzyme was inactivated, DNA was purified, and quantified by qPCR. A naked DNA control served as a reference.
Exploratory VAERS correlation with measured DNA levels
For each batch, VAERS reports from Canada were collected, and the number of serious adverse events (SAEs) was correlated with the measured DNA levels (Spike, ORI, SV40). The aim was to examine a possible relationship between DNA content and reported adverse events. The association was calculated using Pearson’s correlation coefficient.
c) Key Results
qPCR validation
The qPCR assays for Spike and ORI showed excellent performance with R² values of 0.998–0.999 and efficiencies of 94.7–99.8%. The SV40 assay showed slightly lower performance (R² = 0.906, efficiency 93.6%). Negative controls showed no signal.
LNP inhibition
Undiluted samples exhibited PCR inhibition due to lipid nanoparticles. After 1:10 dilution, inhibition was resolved; therefore, diluted samples were used for quantification.
qPCR-based quantification
All Pfizer batches tested positive for Spike, ORI, and SV40. The similar Cq values across all three targets suggest the presence of shared, intact DNA molecules. In Moderna samples, Spike and ORI were detected, but SV40 was absent. ORI signals in Moderna appeared approximately 3 cycles later than Spike, indicating either a lower abundance or fragmentation of the ORI region.
The authors converted Cq values into absolute DNA amounts using the standard curve:
| Vaccine | Spike (ng/dose) | Ori (ng/dose) | SV40 (ng/dose) |
| Pfizer | 0,22 – 2,43 | 0,28 – 7,28 | 0,25 – 23,72 |
| Moderna | 0,25 – 0,78 | 0,01 – 0,34 | not detected |
Pfizer showed higher residual DNA levels than Moderna overall.
Two Pfizer batches (FM7380 and FN7934, monovalent, PBS formulation) exceeded the FDA guideline threshold of 10 ng/dose based on SV40 content, with values up to 23.72 ng/dose. All other batches remained below this level.
Quantification using Qubit fluorometry
The authors measured samples repeatedly at different time points. The average variability (mean deviation from the mean) was:
| Measurement phase | Pfizer | Range |
| Before heating | 317 ± 278 ng/dose | 43 to 727 ng/dose |
| After heating | 1.145 ± 533 ng/dose | 519 to 1.949 ng/dose |
| After RNase A | 297 ± 217 ng/dose | 100 to 765 ng/dose |
| Measurement phase | Moderna | Range |
| Before heating | 456 ± 121 ng/dose | 199 to 675 ng/dose |
| After heating | 1.554 ± 1.023 ng/dose | 176 to 3.169 ng/dose |
| After RNase A | 1.065 ± 624 ng/dose | 113 to 2.365 ng/dose |
After LNP disruption by heating, values increased markedly. Subsequent RNase A treatment reduced the measured signal (crosstalk correction).
Overall, Moderna showed consistently higher DNA levels than Pfizer.
A comparison between Qubit and qPCR showed a positive correlation for Pfizer, but not for Moderna. The authors interpret this discrepancy as evidence of DNA fragments lacking intact primer binding sites, which would therefore not be detected by qPCR.
Fragment length analysis
The longest detected read was approximately 3.5 kb and covered most of the plasmid backbone. This indicates that, in addition to short fragments, larger DNA fragments in the kilobase range are also present in the samples.
DNA located inside LNPs
DNase treatment did not lead to a significant reduction in DNA signal in the vaccine samples (≤1 Cq shift), whereas naked control DNA was fully degraded. This is interpreted as evidence that the DNA is predominantly encapsulated within lipid nanoparticles (LNPs) and therefore protected from enzymatic degradation.
Exploratory VAERS correlation with measured DNA levels
For the analyzed batches, adverse event reports from the US VAERS spontaneous reporting system were used. For all but three Moderna batches, VAERS reports were available.
The authors conducted an exploratory correlation between measured DNA levels and VAERS data. They report that certain batches with higher DNA levels (particularly ORI DNA) also showed higher numbers of reported serious adverse events (SAEs).
d) Interpretation by the authors
The authors conclude that all analyzed batches contain residual DNA that is encapsulated within LNPs and therefore protected from degradation. The measured total amounts exceed existing regulatory guideline values. The SV40 promoter/enhancer element in Pfizer batches is highlighted as particularly relevant, as it may facilitate nuclear targeting and could theoretically increase the likelihood of genomic integration.
The authors also point to several methodological limitations:
| Method | Issue |
| qPCR | Cannot quantify molecules smaller than the amplicon length (105–114 bp), leading to potential underestimation of total DNA |
| Qubit/fluorometry without RNase | Overestimation due to RNA crosstalk (hence RNase treatment is required) |
| Ethanol precipitation | Loss of short fragments (<100 bp) |
| ONT (Nanopore sequencing) | Library preparation biases against fragments <150 bp, skewing results toward longer fragments |
The authors therefore conclude that the choice of method has a significant impact on the results – which is why methodological clarity is essential when setting threshold values.
The authors formulate several recommendations:
| Recommendation | Rationale |
| Reassessment of DNA threshold values | Current regulatory limits were developed for naked DNA in conventional vaccines. They should be reevaluated in light of LNP encapsulation, cumulative dosing, and functional genetic elements. |
| Method standardization | Since qPCR may underestimate total DNA, fluorometry with RNase correction should additionally be used to more accurately quantify residual DNA and the RNA/DNA ratio. |
| Independent replication | Results should be confirmed by other laboratories. |
| Long-term monitoring | Long-term effects (e.g., integration, cancer) are not recorded by VAERS. |
| Consideration of functional sequences | Not only DNA quantity is relevant, but also functional properties – particularly the presence of SV40 elements and promoter sequences. |
The authors interpret variability of residual DNA between and within batches as a potential indicator of inconsistencies in the manufacturing process.
e) Methodological limitations
The qPCR assay cannot detect fragments below the amplicon length (105–152 bp), leading to a systematic underestimation of total DNA content.
The ONT sequencing data are derived from a single batch and are biased toward longer fragments due to the purification method, which preferentially retains larger DNA molecules.
The exploratory VAERS correlation with measured DNA levels is only limitedly interpretable due to well-known limitations of spontaneous reporting systems – particularly the absence of exposure data and potential reporting biases. The authors additionally note further constraints: limited batch size, lack of precise dose administration data, and potential under-detection of long-term effects.
The sample set includes both expired vials and partially used residual volumes, which further reduces comparability within the dataset.
f) Contextualization
The study represents a methodologically expanded continuation of earlier work by the same research group, combining multiple analytical approaches – including qPCR, fluorometric quantification with RNase correction, nanopore sequencing, and functional assays of nuclease susceptibility. A key contribution is the direct comparison of different quantification methods, which highlights how strongly measured DNA levels depend on the analytical technique used.
The qualitative findings – particularly the detection of plasmid DNA in both vaccine types and SV40-related sequences in Pfizer batches – are consistent with other studies (e.g., McKernan et al., Kämmerer et al.). The observation that DNA appears to be encapsulated within lipid nanoparticles is also supported by multiple independent reports.
At the same time, substantial discrepancies are observed in quantitative DNA estimates between methods (qPCR vs. fluorometry), underscoring the importance of methodological standardization and limiting direct comparability across studies.
Overall, the study broadens the existing evidence base through a wider methodological scope and a larger sample size. Its main contribution lies in highlighting methodological issues and variability in measurement outcomes, which require further systematic investigation in future work.
🧬 🧬 🧬
4.3.9. Achs et al. (2025)
| Systematic analysis of COVID-19 mRNA vaccines using four orthogonal approaches demonstrates no excessive DNA impurities Authors: Adam Achs, Tatiana Sedlackova, Lukas Predajna, Jaroslav Budis, Maria Bartosova, Vladimir Zelnik, Diana Rusnakova, Martina Melichercikova, Marta Miklosova, Veronika Gencurova, Barbora Cernakova, Tomas Szemes, Boris Klempa, Juraj Kopacek, Silvia Pastorekova Published: December 13, 2025 (npj Vaccines, peer-reviewed; PMCID verfügbar) Link to study: https://pmc.ncbi.nlm.nih.gov/articles/PMC12715226/ |
a) Context and Objective of the Study
The study by Achs et al. follows a systematic and methodologically broad approach to investigating potential residual DNA in mRNA-based COVID-19 vaccines. It was conducted against the background of earlier reports describing elevated DNA quantities and specific sequence elements in such products.
The primary objective is to reassess these findings using multiple independent and complementary („orthogonal”) analytical methods, with a focus on evaluating the robustness of results against methodological influences. A central question is whether previously reported residual DNA findings are reproducible or can be explained by methodological artifacts.
A further emphasis is placed on evaluating the analytical methods themselves. The authors examine how different detection techniques – such as sequencing, qPCR, and fluorometric assays – may yield divergent results and what methodological limitations need to be considered.
Thus, the study not only aims to quantify potential residual DNA but also to contextualize the existing literature methodologically and assess the reliability of different analytical approaches in this context.
b) Materials and Methods
Vaccine batches
The study analyzed 15 vaccine batches – 9 Comirnaty (Pfizer) and 6 Spikevax (Moderna) – sourced from state-managed vaccine stocks in Slovakia and provided under the supervision of the State Institute for Drug Control. At the time of analysis, four Comirnaty batches were still within their expiration date, while the remaining batches had already expired. All vials were stored and transported according to manufacturer specifications.
A subset of the batches –specifically those also examined in Fleming et al. (Study 7) – was deliberately included to enable direct cross-study comparison.
Four orthogonal analytical methods
A central methodological feature of the study is the application of four independent, complementary analytical approaches on the same samples. Each method has distinct strengths and limitations; their combined use is intended to produce more robust conclusions than any single technique alone.
Method 1: qPCR
The LNPs were disrupted using Triton X-100, and the treated samples were added directly to the qPCR reaction without prior DNA extraction. This avoids a purification step that could lead to DNA loss. The authors explicitly tested for potential PCR inhibition by vaccine components and reported no relevant inhibition of amplification under the conditions used.
Eight primer pairs were employed, targeting three regions of the production plasmid: the spike-coding sequence (SPIKE), the origin of replication (ORI), and the kanamycin resistance gene (KAN). Amplicon sizes varied considerably, ranging from 63 bp (KAN 1C) to 233 bp (SPIKE 2). Two primer pairs – SPIKE 2 and ORI 2 – correspond to those used in Fleming et al., enabling direct comparison between studies.
Quantification was performed using calibration curves based on synthetic DNA standards (gBlocks) matching the respective target sequences. Measured copy numbers were converted into nanograms per dose based on the molecular mass of each amplicon.
Method 2: Fluorometry
For fluorometric DNA quantification, a DNA extraction step was performed using two different extraction approaches: phenol-chloroform extraction (yield 60–80%) and magnetic bead-based extraction for cell-free DNA (yield 90–95%). Both methods included RNase A treatment to eliminate interference from mRNA with the DNA-specific fluorescent dye.
Die RNA-Konzentration nach der Behandlung wurde kontrolliert und auf unter 1 ng/µl gesenkt. The authors experimentally demonstrated that even small amounts of RNA can significantly inflate the DNA signal, and that RNase treatment is necessary to minimize RNA-induced overestimation. After treatment, RNA levels were confirmed to be reduced to below 1 ng/µl.
Method 3: Capillary electrophoresis
Capillary electrophoresis was used to directly visualize very high DNA amounts, such as those reported in some previous studies. If DNA were present at levels of several hundred to thousand nanograms per dose, it would appear as a clear peak or smear in the electropherogram. Samples were treated with Triton X-100 and RNase A prior to analysis. Two kits were used – one covering the standard range (0.5–50 ng/µl) and another for high sensitivity (5–600 pg/µl per fragment).
Method 4: Short-read sequencing (Illumina)
For sequencing, DNA was extracted using an optimized protocol combining heat treatment (95 °C), RNase A digestion, and proteinase K treatment. Library preparation was performed without an additional fragmentation step to preserve the original fragment length distribution as much as possible. Sequencing was carried out on a NextSeq 2000 system using paired-end reads, enabling precise fragment length determination.
Bioinformatic analysis included de novo assembly of reads into complete plasmid sequences, followed by mapping of all reads to the reconstructed reference sequences.
c) Key Results
qPCR findings
All eight qPCR assays were performed in two independent laboratories by three operators. In none of the 15 analyzed batches was the regulatory threshold of 10 ng DNA per dose exceeded.
Clear differences were observed between individual assays, depending on amplicon length. The highest DNA amounts were measured with the shortest amplicon (KAN 1C, 63 bp), reaching up to 8 ng/dose for Comirnaty. The lowest values were obtained with the longest amplicons (SPIKE 1A and SPIKE 2, 228–233 bp), at approximately 0.5–0.7 ng/dose. The authors attribute this discrepancy to DNA fragment length: with a median fragment length of ~150 bp, longer amplicons fail to detect many fragments because they are too short to contain both primer binding sites.
They interpret this consistent pattern across assays as evidence for the internal consistency of their methodological approach.
Fluorometry
After complete RNase A treatment and DNA extraction, fluorometrically measured DNA levels in all batches were below the regulatory threshold of 10 ng per dose.
The authors experimentally demonstrated that insufficient RNase treatment can substantially overestimate DNA signals: even small amounts of RNA generate a measurable background signal in the DNA assay.
RNA measurements showed that all Comirnaty batches contained at least 90% of the declared mRNA content. In some Spikevax batches, values were lower, which the authors attribute to advanced expiration and degradation over time.
Capillary electrophoresis
No specific DNA signal was detected in any of the analyzed batches – neither with the standard kit (detection range 0.5–50 ng/µl) nor with the high-sensitivity kit (5–600 pg/µl per fragment). Weak, non-specific signals around 60 and 300 bp were observed in some samples, but these also appeared in the negative controls and were therefore attributed to methodological background noise.
The authors argue that if DNA were present at levels of several hundred to thousand nanograms per dose, it would appear as a clear peak or smear in capillary electrophoresis. The complete absence of such a signal is considered inconsistent with such high DNA estimates.
RNA integrity analysis showed that six of nine expired batches had mRNA integrity below 50%, which was also visually reflected in a more turbid appearance of these vials compared with clear, non-expired samples.
Sequencing
The full sequences were generated bioinformatically by assembling many overlapping short reads and do not necessarily represent direct evidence of physically intact plasmid molecules.
The proportion of plasmid-derived reads was 96.6% for Comirnaty (range: 95.3–98.1%) and 88.7% for Spikevax (range: 83.5–94.5%). The remaining reads mainly originated from E. coli K12 – a non-pathogenic laboratory strain – as well as bacteriophage sequences and repetitive sequences without database matches. The authors note that part of these reads may be attributable to reagent contamination, as described in the literature.
Fragment length analysis showed a median length of 154 bp for Comirnaty (range: 130–181 bp) and 144 bp for Spikevax (range: 127–201 bp). The fraction of fragments longer than 300 bp was low. Genome coverage across the plasmid was uneven, a pattern the authors consider consistent with incomplete or non-uniform DNase digestion.
d) Interpretation by the authors
DNA levels below regulatory threshold
The authors conclude that residual DNA in all 15 analyzed batches complies with the regulatory threshold of 10 ng per dose. In their view, this finding is robust because it is consistently supported across multiple complementary analytical methods. They further argue that the inclusion of expired batches strengthens the overall conclusion: even under conditions potentially associated with degradation or instability, no excessive DNA levels were detected.
Origin and nature of the DNA
The authors conclude that the detected DNA originates exclusively from the production plasmid, i.e., from an expected and well-characterized by-product of the manufacturing process. According to their analyses, the DNA is highly fragmented, with a median fragment length of approximately 150 bp. In the authors‘ assessment, fragments of this size fall below the range typically associated with biological activity such as plasmid replication or efficient genomic integration.
Explanation for differing findings in earlier studies
The authors discuss several methodological factors that, in their view, may help explain why some previous studies reported substantially higher DNA levels.
First, they argue that fluorometric DNA assays can be significantly affected by residual mRNA if RNase treatment is incomplete. In their own control experiments, even small amounts of remaining RNA produced a noticeable increase in the apparent DNA signal. They therefore suggest that some of the elevated DNA values reported in earlier studies may have been influenced by RNA-related crosstalk effects.
Second, they emphasize the impact of amplicon length in qPCR-based assays. Because the detected DNA is largely fragmented, longer amplicons can only detect a subset of the available fragments. As a result, differences between studies may partly reflect differences in primer design and target regions rather than true differences in DNA content.
Overall, the authors interpret their findings as indicating that the detection of residual DNA in mRNA vaccines is highly method-dependent and that standardized analytical methods are needed.
Methodological Recommendations
The authors recommend the following for future analyses: complete RNase treatment with verification of residual RNA levels prior to fluorometric DNA measurement; direct use of Triton X-100–treated vaccine material for qPCR without prior DNA extraction to avoid losses; the use of short amplicons to achieve more comprehensive detection of fragmented DNA; and the combination of multiple complementary methods to ensure robust conclusions.
Biological Assessment
The authors consider the risk posed by the detected residual DNA to be negligible, citing its low quantity, known plasmid origin, high degree of fragmentation, and the fact that no eukaryotic cell lines are used during manufacturing. They do not see any need to revise the existing regulatory limits or manufacturing practices.
e) Methodological Limitations
Amplicon Size and Fragment Length
The authors themselves demonstrate that the measured DNA quantities depend strongly on the amplicon size of the respective qPCR assay. Using the shortest amplicon (KAN 1C, 63 bp), up to 8 ng per dose was measured – close to the regulatory limit. In contrast, the longest amplicons (SPIKE 1A and SPIKE 2, 228–233 bp) yielded only 0.5–0.7 ng per dose.
These differences within the same study illustrate that qPCR results are substantially influenced by the chosen assay design. The measured values therefore do not represent an absolute total DNA content, but rather the fraction of DNA fragments that can be detected by the specific primer set used in each assay.
Fragment Length Determination by Illumina Sequencing
Sequencing revealed median fragment lengths of approximately 130–201 bp. However, these values should not be interpreted as direct measurements of the native fragment-length distribution.
Library preparation involves multiple SPRI cleanup steps as well as PCR amplification, both of which can systematically disadvantage very short fragments (<150 bp). At the same time, very long fragments (>800 bp) may also be represented less efficiently during library preparation and sequencing, potentially resulting in underrepresentation or failure to be detected. Consequently, the reported length distribution primarily reflects the fragments that remained detectable after library preparation, rather than necessarily representing the original distribution present in the vaccine.
Therefore, the study does not permit definitive conclusions regarding either the true proportion of very short DNA fragments below the detection threshold or the possible presence of longer DNA fragments outside the size range that can be efficiently captured by the sequencing workflow.
Calculation Method in qPCR
The measured copy numbers were converted into nanograms based on the molecular mass of the respective qPCR amplicons, rather than using the full plasmid length. This approach is methodologically consistent for quantifying the actually amplified target regions. However, the resulting nanogram values are not directly comparable to studies that base their calculations on complete plasmid sequences.
Influence of Extraction Efficiency
The fluorometric DNA measurements also depend on the efficiency of the extraction method used. The authors report an extraction yield of approximately 60–80% for phenol-chloroform extraction and about 90–95% for magnetic bead-based methods.
Incomplete extraction can in principle lead to a fraction of the existing DNA – particularly very short fragments or nucleic acids still associated with lipid nanoparticles (LNPs) – not being fully recovered. Accordingly, bead-based extractions in the study tended to yield higher DNA values than the phenol-chloroform method.
No Measurement Before LNP Disruption
In contrast to some earlier studies, no systematic comparative measurements were performed before and after targeted disruption of lipid nanoparticles (LNPs). As a result, the data do not allow a direct inference regarding the proportion of detected DNA that was encapsulated within lipid nanoparticles.
Capillary Electrophoresis: Limit of Detection
Capillary electrophoresis is well suited for detecting larger amounts of DNA. However, its sensitivity is limited for very low concentrations in the single-digit nanogram range. The method therefore complements qPCR and sequencing data but does not replace them.
No SV40-Specific Analysis
The study does not include a specific assay for SV40 promoter/enhancer sequences. Consequently, no conclusions can be drawn from the data regarding the presence or absence of such sequences. This does not constitute a methodological weakness in a strict sense, as the investigation was not designed to detect SV40; however, compared to other studies, this aspect remains unaddressed.
f) Contextualization
The study by Achs et al. represents one of the most methodologically comprehensive investigations to date into residual DNA in mRNA vaccines. It combines multiple complementary analytical approaches – qPCR with amplicons of varying lengths, fluorometric measurements with controlled RNase treatment, capillary electrophoresis, and short-read sequencing – performed on the same samples and across two different laboratories. This allows potential methodological artifacts of individual techniques to be better identified and contextualized.
In the overall context of the existing literature, the study highlights that the detection and quantification of residual DNA in mRNA vaccines is strongly method-dependent. Differences in sample preparation, extraction methods, RNase treatment, qPCR design, and sequencing approaches can lead to substantially different results.
Compared with earlier work, the study supports the assessment that the investigated batches do not contain unusually high levels of residual DNA. At the same time, several methodological questions – particularly regarding the complete fragment-length distribution of very short or very long DNA fragments – remain unresolved even with this approach.
Thus, the work by Achs et al. contributes less to a definitive resolution of the controversy than to a more precise methodological framing of the existing findings. In this sense, it complements previous studies – not by broadly contradicting their results, but by clarifying under which methodological conditions specific conclusions can be drawn.
4.4. What do we know – and what do we not know?
What the Available Studies Show in Common
The studies presented in this chapter originate from different laboratories, were conducted at different times, and employ partially distinct analytical methods. Nevertheless, several findings can be identified that are consistent across multiple studies.
First: Residual DNA is detectable in mRNA-based COVID-19 vaccines. This is not an unexpected finding; it is a known and anticipated consequence of the manufacturing process, which uses a DNA template for in vitro transcription. It is well established in the scientific literature that DNase I digestion does not guarantee complete removal of all DNA fragments.
Second: The detected DNA predominantly originates from the production plasmid. This is consistently shown by sequencing data from McKernan, Raoult, and Achs et al., as well as by PCR-based analyses from multiple research groups.
Third: Several studies provide indications that a relevant fraction of the detected DNA is protected from enzymatic degradation and is associated with lipid nanoparticles.
Where the Studies Diverge
The central question of dispute – how much DNA is actually present and whether regulatory limits are complied with – is answered differently across the available studies. These discrepancies are not primarily attributable to differences in the samples themselves, but can at least in part be explained by differences in methodological approaches.
Fluorometric measurements without adequate RNase treatment systematically yield higher values because the dye also binds RNA. PCR-based measurements depend on amplicon size: longer amplicons detect fewer fragments and therefore underestimate total DNA content. Sequencing methods provide qualitative information on sequence identity and fragment length, but do not offer reliable absolute quantification. Each method therefore measures slightly different aspects and correspondingly produces different numerical results.
This means that differences between studies are not necessarily evidence of flawed work by any of the research groups. Instead, they can – and in many cases must – be understood as a reflection of methodological variability.
What Remains Open
Despite the growing body of data, several questions remain unresolved.
The question of the true fragment-length distribution – particularly the proportion of very short fragments below 100 bp – has not yet been conclusively clarified. Illumina sequencing systematically underestimates short fragments, while ONT datasets can be more strongly influenced by longer fragments due to process-related selection and sequencing biases. A method that accurately captures the native fragment distribution without size-dependent distortion has not been applied in the available studies.
The biological relevance of the detected DNA – including questions of potential cellular uptake, persistence, or genomic integration – has not been directly investigated so far. Existing theoretical models and analogies from other biological systems are currently insufficient to draw robust conclusions about actual risk, although they do justify further investigation.
The question of the SV40 promoter/enhancer – its actual prevalence across different batches and its biological activity in fragmented form – has been addressed inconsistently across studies and remains unresolved.
What This Means for the Scientific Debate
A fundamental issue running through all the studies discussed here is the absence of a standardized, validated analytical protocol for the measurement of residual DNA in the final vaccine product. Regulatory limits do exist, but the methods used to verify them are not uniformly defined. As a result, different laboratories using different methods arrive at different results, without a straightforward way to compare them directly.
A meaningful next step would be the establishment of an orthogonal standard protocol: the same sample analyzed using multiple validated methods across several independent laboratories. Only such an approach would allow methodological variability to be distinguished from true batch-to-batch differences – and thereby generate robust, comparable data.
Regulatory Context
Regulatory limits for residual DNA were originally developed for traditional biological medicinal products and not specifically for LNP-formulated modRNA vaccines. To what extent existing limits and testing procedures are fully transferable to this newer platform technology has not yet been conclusively addressed.
Overall Assessment
The studies available so far have played an important role in initiating a scientific discussion that would otherwise likely not have taken place. At the same time, they also highlight the limitations of independent re-analyses outside a fully standardized regulatory framework: lack of validation, limited sample sizes, and methodological heterogeneity.
What remains is a scientifically grounded demand for greater transparency, more standardized methods, and independent replication across different research groups. This is not an alarmist conclusion – it reflects what sound science generally requires.
5. Conclusion and Outlook
The discussion of residual DNA in mRNA vaccines illustrates on multiple levels how complex the analytical evaluation of novel biological medicinal products can be.
What initially appears to be a simple question – whether residual DNA is present and in what quantity – turns out, upon closer examination, to depend strongly on sample preparation, detection methods, and data interpretation.
Key Findings of the Study
The production of modRNA-based vaccines involves a multi-step process in which bacterial DNA templates are indispensable. The removal of this DNA is part of the standard purification steps in the manufacturing process. However, the available investigations consistently show that residual DNA fragments can be detected in commercial vaccine batches – albeit in quantities that vary depending on the analytical method used.
The evaluation of existing studies makes clear that the detection and quantification of residual DNA is considerably more complex than regulatory threshold values alone might suggest. Different lysis procedures, extraction methods, RNase treatments, qPCR designs, and sequencing approaches can lead to substantially divergent results.
The controversy of recent years thus highlights not only differences between individual studies, but above all the limitations arising from the lack of standardization in independent re-analyses.
Open Questions for Future Research
Despite the substantial amount of data now available, several questions remain unresolved:
What is the actual proportion of very short or potentially biologically active DNA fragments across different vaccine batches?
What is the validity of current analytical methods with regard to the native fragment-length distribution in the vaccine product?
What role do RNA:DNA hybrids or other nucleic acid complexes play in the stability and detectability of residual DNA?
Finally, what is the biological relevance of the detected DNA fragments – including the SV40 promoter/enhancer element – under real physiological conditions?
Many of these questions cannot currently be either definitively confirmed or ruled out based on the available data. They require further investigation using standardized, orthogonal analytical approaches as well as independent replication across multiple laboratories.
Outlook
The scientific discussion on residual DNA in modRNA vaccines is therefore not yet concluded. At the same time, existing research shows that a clear distinction must be made between analytical detection and biological significance.
While the present work focuses on manufacturing processes, detection methods, and experimental findings, the question of potential biological effects remains a subject for further research and future consideration. This includes, among other things, questions regarding the biological activity of residual DNA, the stability of nucleic acid complexes, theoretical integration mechanisms, and the relevance of functional sequence elements.
Regardless of the interpretation of individual studies, a fundamental scientific requirement emerges: greater transparency, better standardized analytical procedures, and reproducible independent investigations. Especially in the context of novel biological technologies, this is not an exceptional demand, but a core component of scientific quality assurance.

Acknowledgements
I would like to express my sincere gratitude to all scientists, researchers, and dedicated individuals who, through their work – across studies, articles, and lectures – contribute to the investigation of this complex topic. Their commitment is of invaluable importance, both for the advancement of knowledge and for a fact-based public discourse.
The scientific debate that this text seeks to document is not a flaw – it is the essence of good science.
✧ ✧ ✧
Postscript
I began this text as a layperson.
With uncertainty, curiosity, and open questions.
Perhaps that was an advantage.
Many questions received answers.
New questions emerged.
The deeper I went, the clearer it became:
It is not only biology that is complex.
The measurement of biology is complex as well.
The journey through this subject was long.
Along the way, I received help:
patient AI systems that explained,
challenged, structured, formulated – and thought along with me.
These were long, productive dialogues
between human and machine.
And in the end, one important insight remains:
learning is a shared process.
Current as of June 2026.
